See also

 06.06.2025 04:43 AM
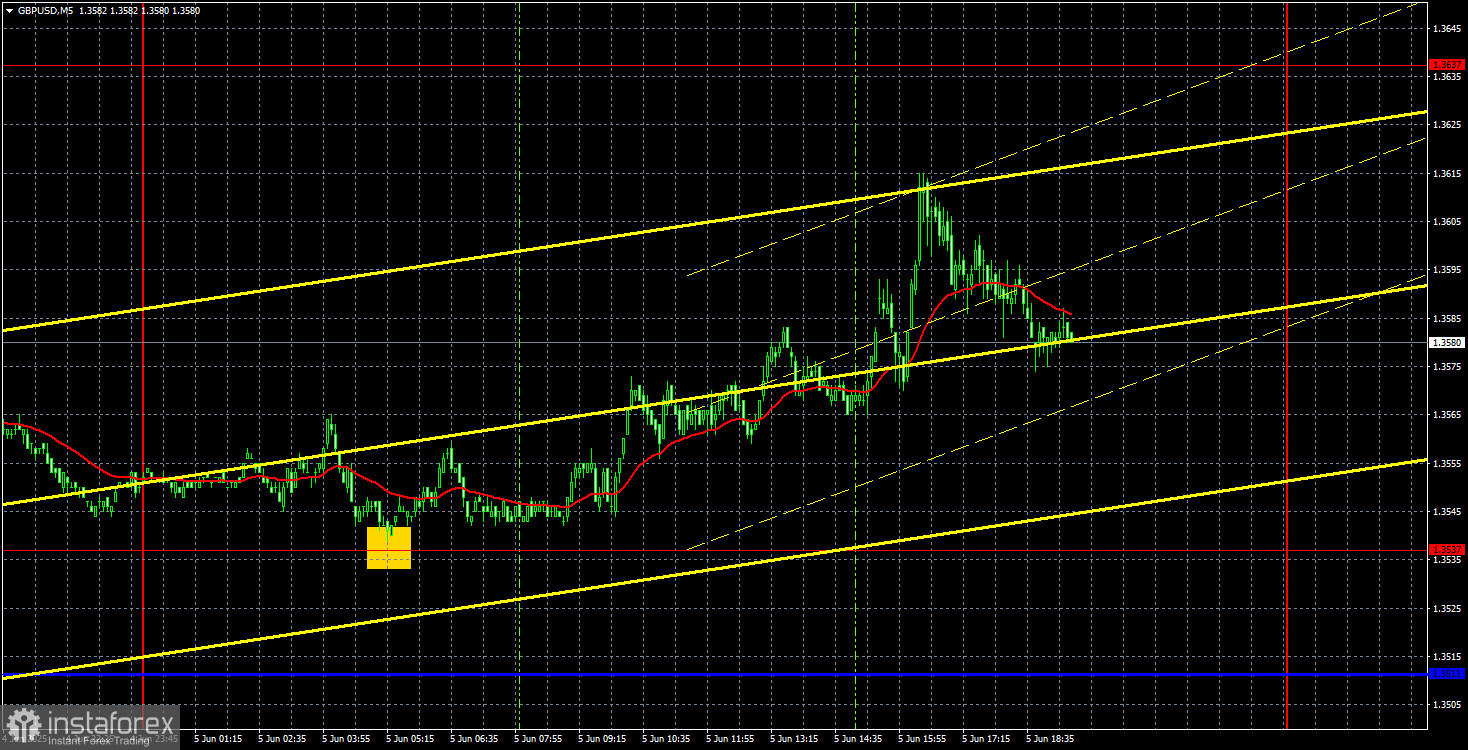
The GBP/USD currency pair continued its upward movement on Thursday, even though once again there were no apparent reasons for it. The British pound keeps rising practically on any occasion — or even without one. If there is news supporting the pound or not supporting the dollar, the pound rises. If there is no news, the pound stands still. If the euro rises, the pound rises with it. If there is a technical signal to rise — excellent, the pound will show growth there too. The ECB meeting had no direct relation to the British currency and, moreover, had a distinctly "dovish" tone. Yet, the euro rose again, and therefore the pound rose as well.
From a technical perspective, a new upward trend persists, which began right after the completion of the previous upward trend. This is the objective reality for the British currency right now. After one uptrend ends, another one immediately starts. On Friday, the most important reports will be released in the U.S., and there's little doubt that if they disappoint, the dollar will once again plunge. If the labor market and unemployment reports turn out strong, the dollar can at best hope for a correction.
On the 5-minute timeframe, exactly one trading signal was formed on Thursday. Overnight, the price rebounded from the 1.3537 level with minimal error, but by the time the European session opened, the pair had moved a minimal distance away from the signal point. Therefore, a buy trade could be safely opened. From there, the pound just kept rising. The price didn't quite reach the nearest target level at 1.3637, so the buy trade could have been closed anywhere. In any case, it would have ended in profit.
COT Report
The COT reports for the British pound show that commercial traders' sentiment has been constantly shifting in recent years. The red and blue lines, representing the net positions of commercial and non-commercial traders, constantly cross and are usually near the zero mark. They are also currently close to each other, indicating an approximately equal number of long and short positions. However, over the past year and a half, the net position has been growing.
The dollar continues to fall due to Donald Trump's policies, so the demand of market makers for the pound sterling is not particularly relevant right now. If the de-escalation of the global trade war resumes, the U.S. dollar would have a chance to strengthen somewhat. According to the latest report on the British pound, the "Non-commercial" group opened 14.2 thousand buy positions and 2.8 thousand sell positions. Thus, the net position of non-commercial traders grew by 11.4 thousand positions.
The pound has risen significantly recently, but it's important to understand that there's only one reason — Donald Trump's policy. As soon as this reason is neutralized, the dollar may start to grow, but when that will happen is anyone's guess. The pound itself has no fundamental reason to rise. Nevertheless, traders currently have more than enough of the "Trump factor" to make trading decisions.
GBP/USD 1H Analysis
On the hourly timeframe, the GBP/USD pair maintains an upward trend, despite consolidating below the ascending channel. Further movement of the pair entirely depends on Donald Trump and developments in the Global Trade War rather than technical analysis. The overall market sentiment and attitude toward America and its president's policies remain sharply negative, making it extremely difficult for the dollar to expect any strong growth. Additionally, Trump keeps disappointing the market with new measures and tariffs, and macroeconomic statistics from across the ocean are increasingly disappointing.
For June 6, we highlight the following important levels: 1.2981-1.2987, 1.3050, 1.3125, 1.3212, 1.3288, 1.3358, 1.3439, 1.3489, 1.3537, 1.3637-1.3667, 1.3741. The Senkou Span B (1.3462) and Kijun-sen (1.3529) lines can also serve as signal sources. It's recommended to set the Stop Loss to breakeven once the price moves 20 points in the right direction. The Ichimoku indicator lines may shift during the day, which should be considered when determining trading signals.
On Friday, no important events are scheduled in the UK, while in the U.S. extremely important labor market and unemployment reports will be published. This data could trigger a strong market reaction.
Explanation of the Illustrations:


