See also


 06.06.2025 08:13 AM
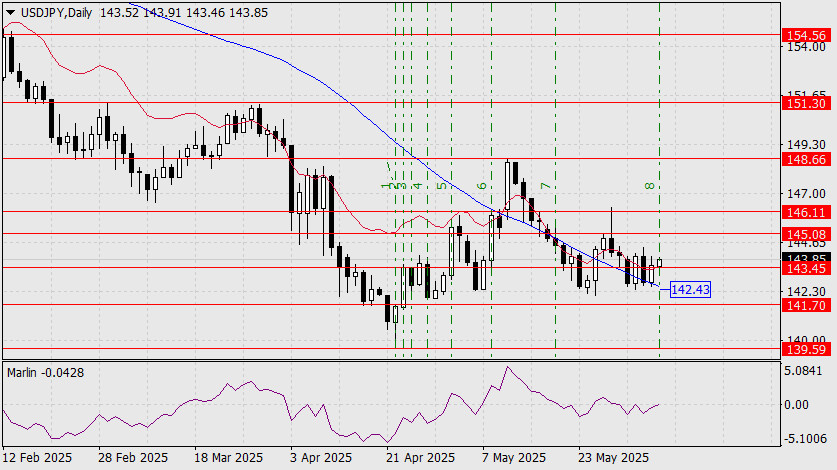
As of this morning, the USD/JPY pair has found itself in a completely dual situation, with an equal likelihood of both growth and decline. Indicators suggesting growth include the price holding above the 143.45 level, the inability of the price to fall below the MACD line, and the current candlestick resting exactly on the Fibonacci time line with a growing upward intention. The Marlin oscillator is testing the boundary of the growth territory, where the probability of an upward breakout slightly exceeds the likelihood of a downward reversal.
However, even if today's candlestick turns out to be black, by Monday a new candlestick must consolidate below the MACD line (142.43); otherwise, this bearish push will also prove to be short-lived. The target for growth is 146.11. Under the current circumstances, the 145.08 level appears to be an intermediate target. If today's Nonfarm Payrolls weaken the dollar, the primary downward target will be 139.59, which could be reached within 2–3 days.
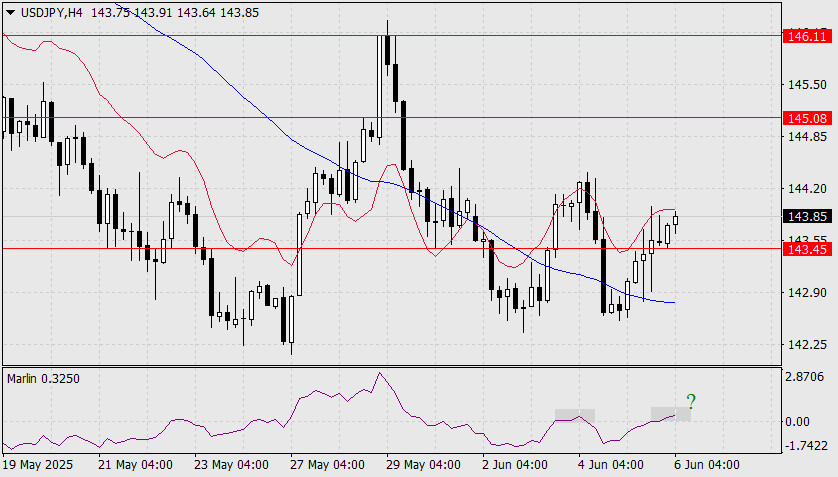
On the four-hour chart, the price is rising above the indicator lines, above the 143.45 level, and the Marlin oscillator has moved into positive territory. However, all these signs of growth could turn out to be false, as happened on June 3–4 (the gray area on the oscillator). We await the release of U.S. labor data.
You have already liked this post today
*The market analysis posted here is meant to increase your awareness, but not to give instructions to make a trade.


