See also

 10.06.2025 04:46 AM
On the weekly chart, the price has broken above the MACD line today, and the week opened above the intermediate level of 5998. The Marlin oscillator is showing a confident upward movement.
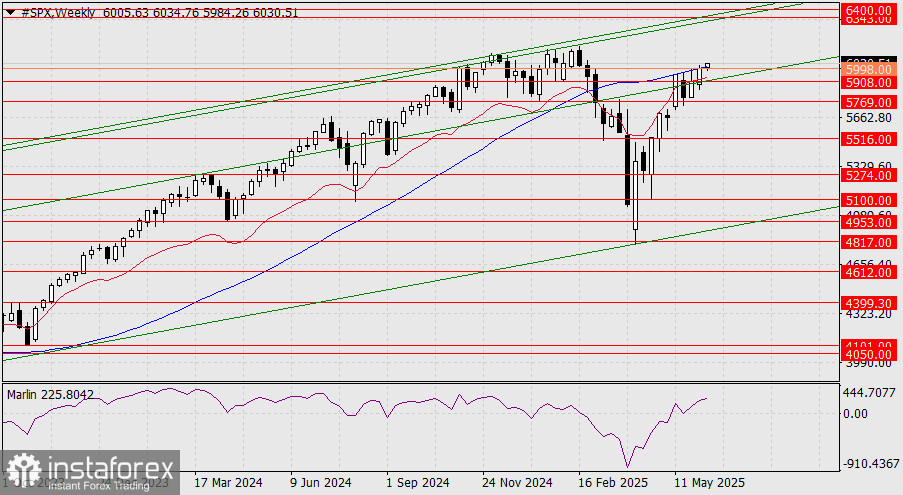
Even though there are still 4 days until the weekly close to confirm a candle settlement above the MACD line and to formally open the target range of 6343–6400, early signs of this development are already visible.
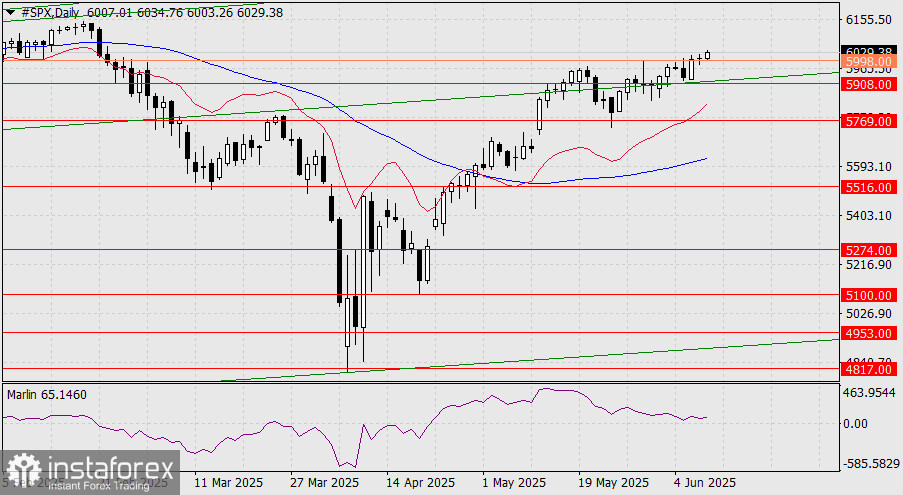
On the daily chart, as of the end of yesterday's session, the price settled above the 5998 level. From a daily perspective, the opportunity for growth is now available. The Marlin oscillator is turning upward while remaining in the zone of an uptrend, which signals readiness to move toward the overbought zone.
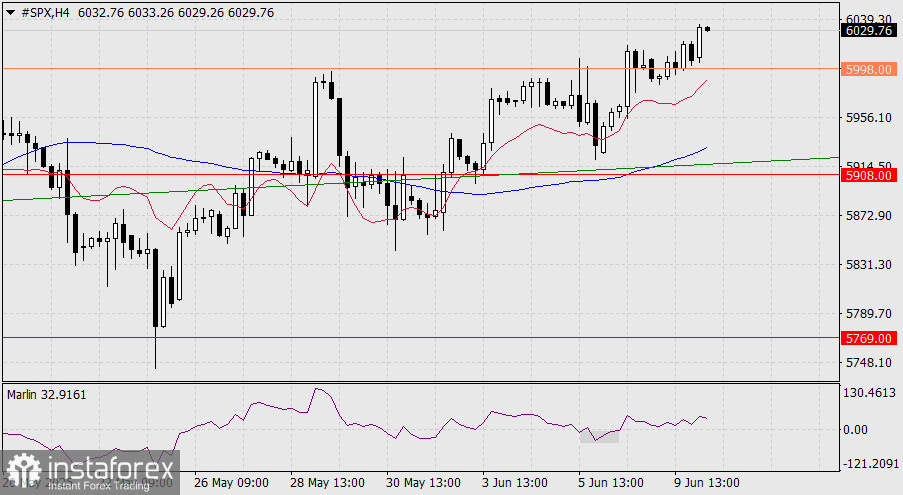
On the four-hour chart, the price consolidates and rises above the 5998 level in both indicator lines. The settlement of the oscillator's signal line below the zero line on June 5–6 (gray rectangle) turned out to be a false signal, which indicates the upcoming growth.
You have already liked this post today
*The market analysis posted here is meant to increase your awareness, but not to give instructions to make a trade.


