See also

 10.06.2025 06:40 AM
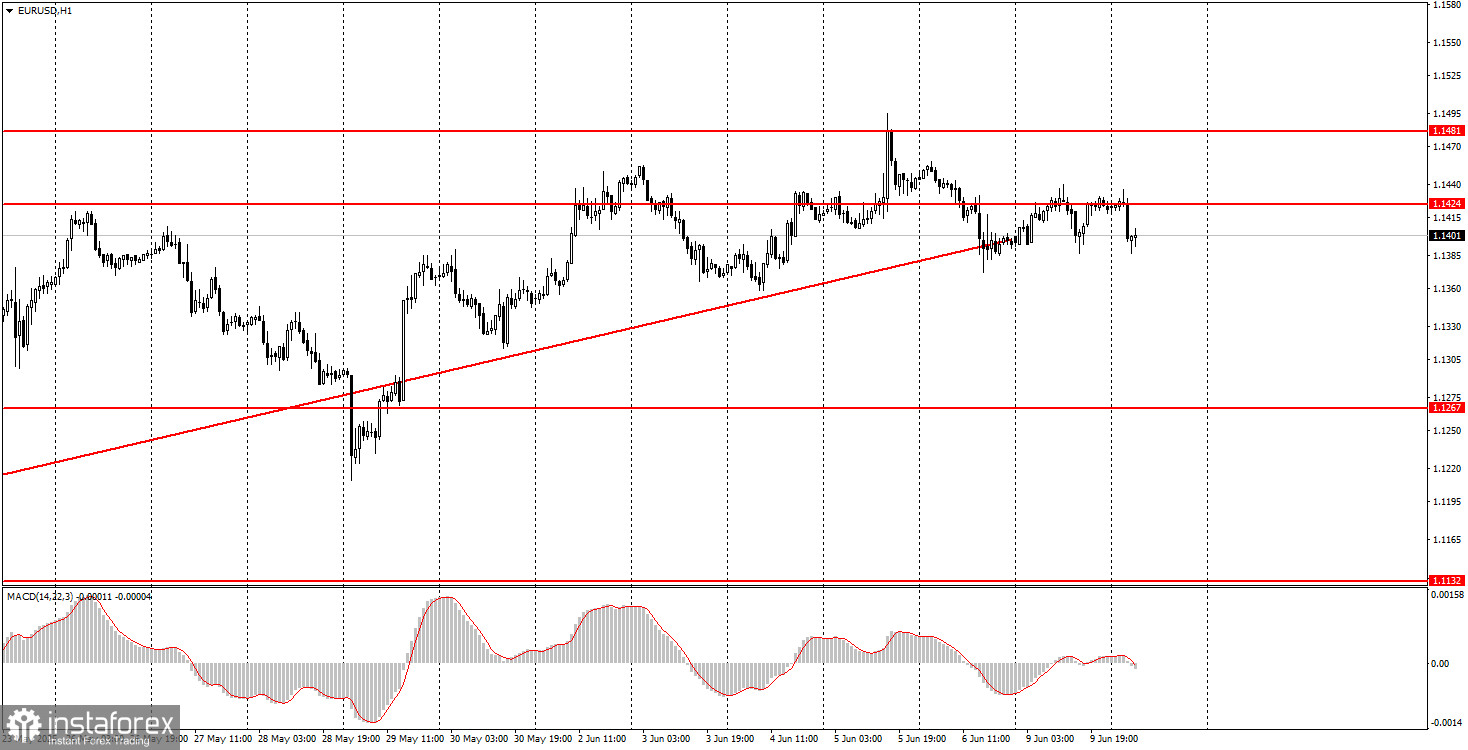
The EUR/USD currency pair traded with low volatility and in both directions on Monday. That day, the macroeconomic backdrop was practically absent, leaving traders with very little to react to. Of course, news continues to pour out of the United States constantly, as Donald Trump keeps making numerous decisions and statements that are now shocking not only to economists. As a reminder, on June 6, mass protests and riots erupted in many American cities against Trump's new immigration policy. In response, Trump ordered the deployment of the National Guard to suppress the protests—something he had no right to do without the consent of the governors and mayors of the relevant cities and states. Thus, Trump again made a unilateral decision, demonstrating that the other branches of government seem to exist just for show. In our view, this is yet another reason for the market to avoid the US dollar at all costs.
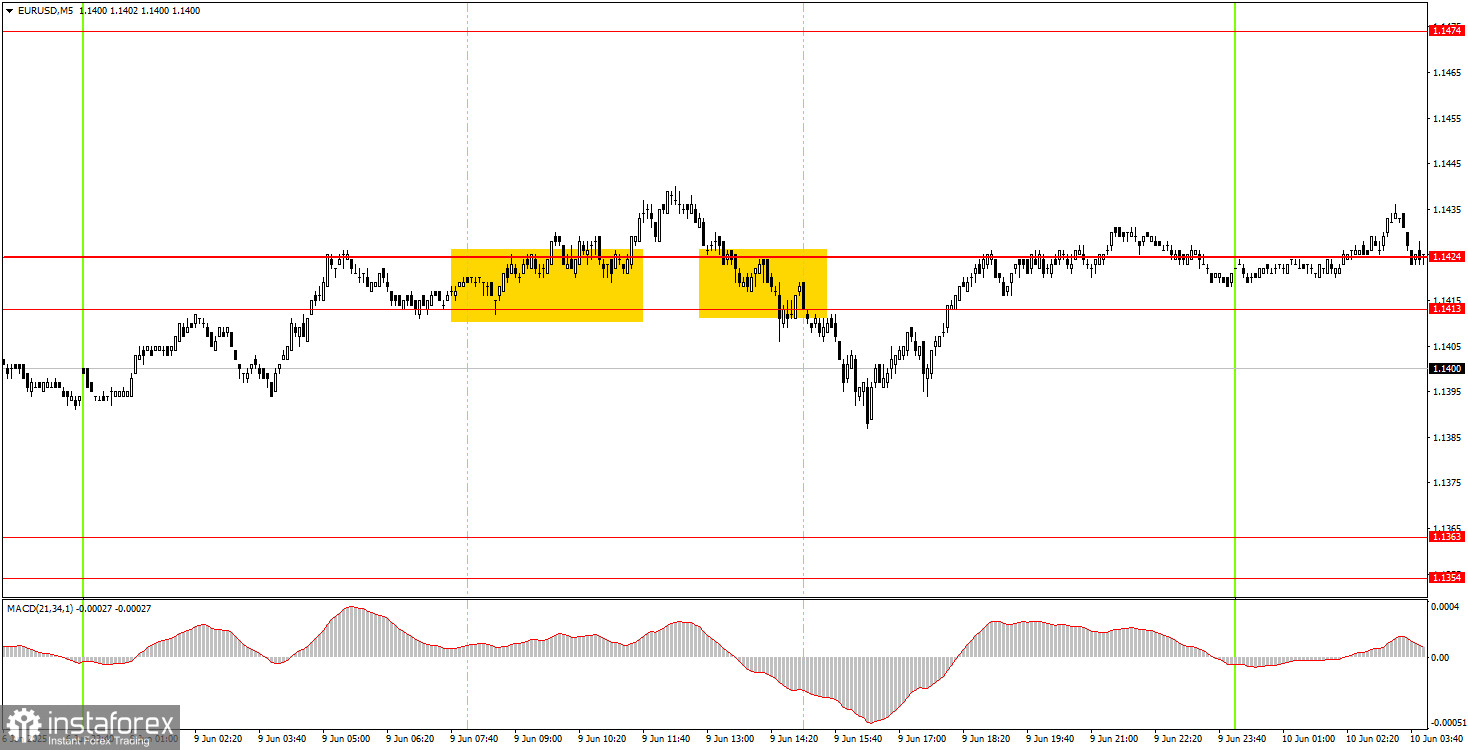
Two trading signals were formed in the 5-minute timeframe on Monday. First, the price broke through the 1.1413–1.1424 area but failed to continue its upward movement. Then, the pair consolidated below the 1.1413–1.1424 area but could not continue moving in the desired direction again. In the second case, the price moved 15 pips in the correct direction, enough to set a breakeven Stop Loss. However, making a profit on Monday was extremely difficult due to the fluctuations in the market.
In the hourly timeframe, the EUR/USD pair broke through the ascending trendline, but the uptrend that began under Trump remains intact. At this point, the fact that Trump is President of the United States is enough for the dollar to fall consistently. This alone is a strong reason for the market to flee the dollar without hesitation. If Trump continues to issue threats, set ultimatums, impose/increase tariffs, and make other provocative decisions, the market will have few options. His tariffs could not be canceled, and talks with China and the EU are stalling again, so the trade war situation isn't improving.
On Tuesday, the EUR/USD pair may move in either direction. With very little macroeconomic data scheduled, traders should rely on technical levels and be prepared for more sideways movement.
On the 5-minute timeframe, the following levels should be considered: 1.0940–1.0952, 1.1011, 1.1088, 1.1132–1.1140, 1.1198–1.1218, 1.1267–1.1292, 1.1354–1.1363, 1.1413–1.1424, 1.1474–1.1481, 1.1513, 1.1548, 1.1571, 1.1607–1.1622. No significant events are scheduled in the Eurozone or the US on Tuesday, but information from Trump that could once again shake the markets may arrive at any moment. If none is forthcoming, a flat session is likely.
Support and Resistance Levels: These are target levels for opening or closing positions and can also serve as points for placing Take Profit orders.
Red Lines: Channels or trendlines indicating the current trend and the preferred direction for trading.
MACD Indicator (14,22,3): A histogram and signal line used as a supplementary source of trading signals.
Important Events and Reports: Found in the economic calendar, these can heavily influence price movements. Exercise caution or exit the market during their release to avoid sharp reversals.
Forex trading beginners should remember that not every trade will be profitable. Developing a clear strategy and practicing proper money management are essential for long-term trading success.


