See also

 10.06.2025 06:40 AM
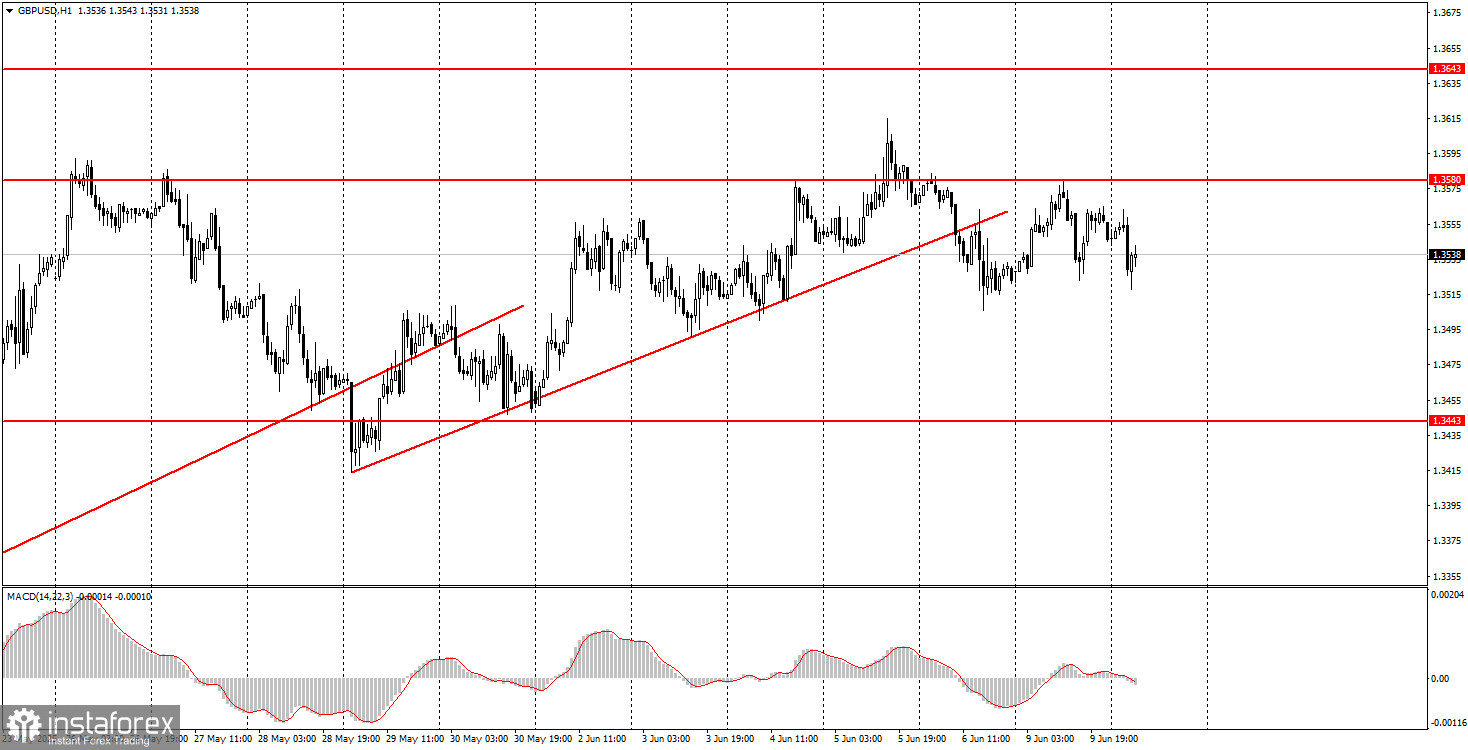
The GBP/USD pair also traded in both directions on Monday. On Friday, the price consolidated below the ascending trendline, formally changing the trend to bearish. Formally—because we saw something similar a week ago when the pound sterling also consolidated below the previous ascending trendline. At that time, however, we didn't see any significant decline in the pair. Thus, the current fundamental background suggests that a new decline in the dollar can be expected at any moment—even if a buy signal is formed or the trend has turned downward. The market doesn't want to deal with a currency whose country's president regularly attends court, takes strange and unconstitutional actions, fuels trade conflicts, and fails to fulfill campaign promises. The U.S. economy is currently teetering on the edge of recession, but no one knows what new tariffs Donald Trump might introduce or raise. As the saying goes, don't count your chickens before they hatch.
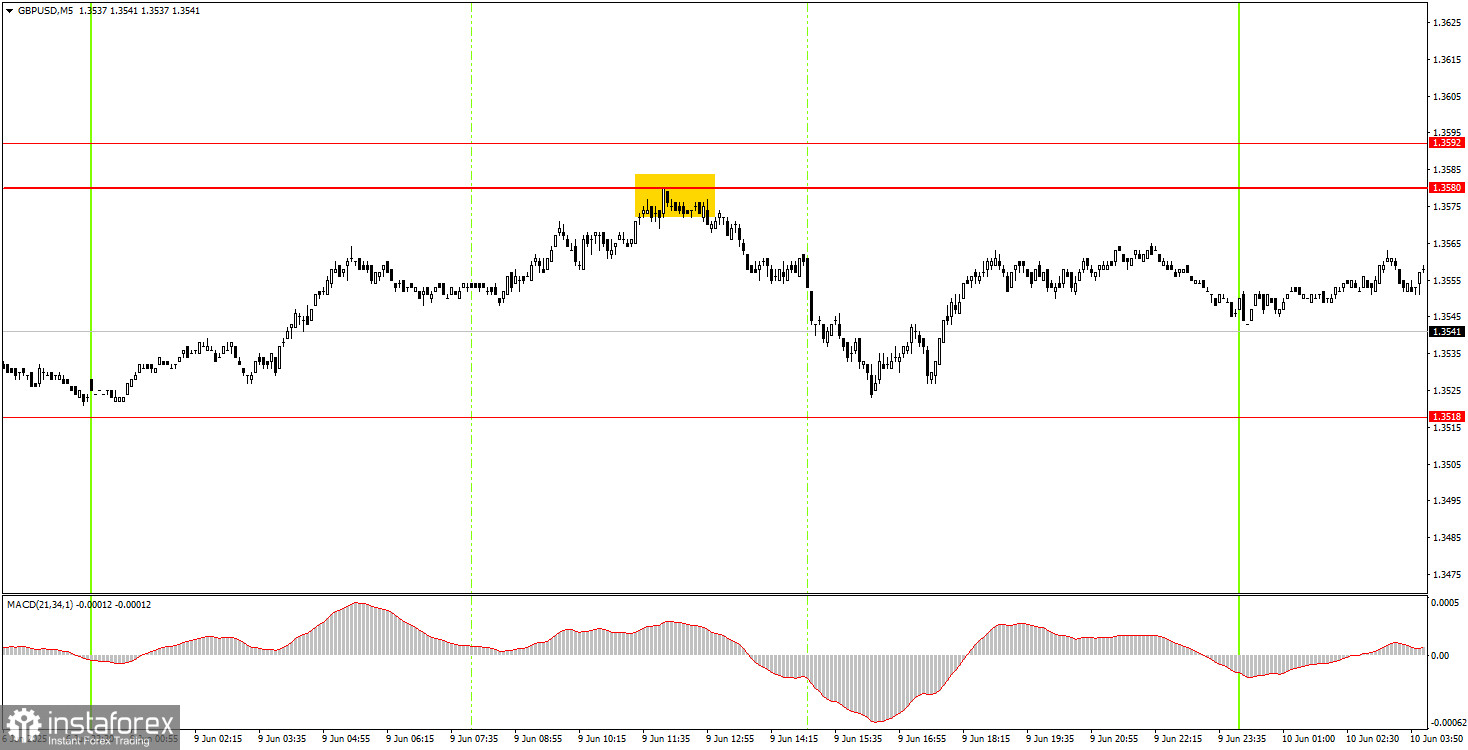
One very good sell signal was formed in the 5-minute timeframe on Monday. During the European trading session, the pair bounced off the 1.3580 level and then dropped almost to the 1.3518 level, which was the nearest target. Unfortunately, this level wasn't clearly tested, but the trade could have been closed manually at any time. It still would have yielded a profit for novice traders.
In the hourly timeframe, the GBP/USD pair continues to respond solely to Trump and still views his policies skeptically. Some signs of de-escalation in trade tensions are present, but the market isn't brimming with optimism, while there are far more signs of renewed escalation. Therefore, as before, the market uses every opportunity to sell the dollar rather than buy it. This will continue until the market sees real signs of the end of the trade war and Trump stops making decisions beyond his authority.
On Tuesday, the GBP/USD pair may continue a mild downward movement (since the price did consolidate below the trendline) unless Trump once again prevents the dollar from strengthening.
On the 5-minute timeframe, the levels for trading are: 1.3043, 1.3102–1.3107, 1.3203–1.3211, 1.3259, 1.3329–1.3331, 1.3421–1.3443, 1.3518, 1.3580–1.3592, 1.3652–1.3660, 1.3695.
No significant events are scheduled in the U.S. for Tuesday, while the UK will publish reports on unemployment, jobless claims, and wages. These are not the most critical data, and market reaction is only likely in case of forecast deviations.
Support and Resistance Levels: These are target levels for opening or closing positions and can also serve as points for placing Take Profit orders.
Red Lines: Channels or trendlines indicating the current trend and the preferred direction for trading.
MACD Indicator (14,22,3): A histogram and signal line used as a supplementary source of trading signals.
Important Events and Reports: Found in the economic calendar, these can heavily influence price movements. Exercise caution or exit the market during their release to avoid sharp reversals.
Forex trading beginners should remember that not every trade will be profitable. Developing a clear strategy and practicing proper money management are essential for long-term trading success.


