See also

 11.06.2025 06:10 AM
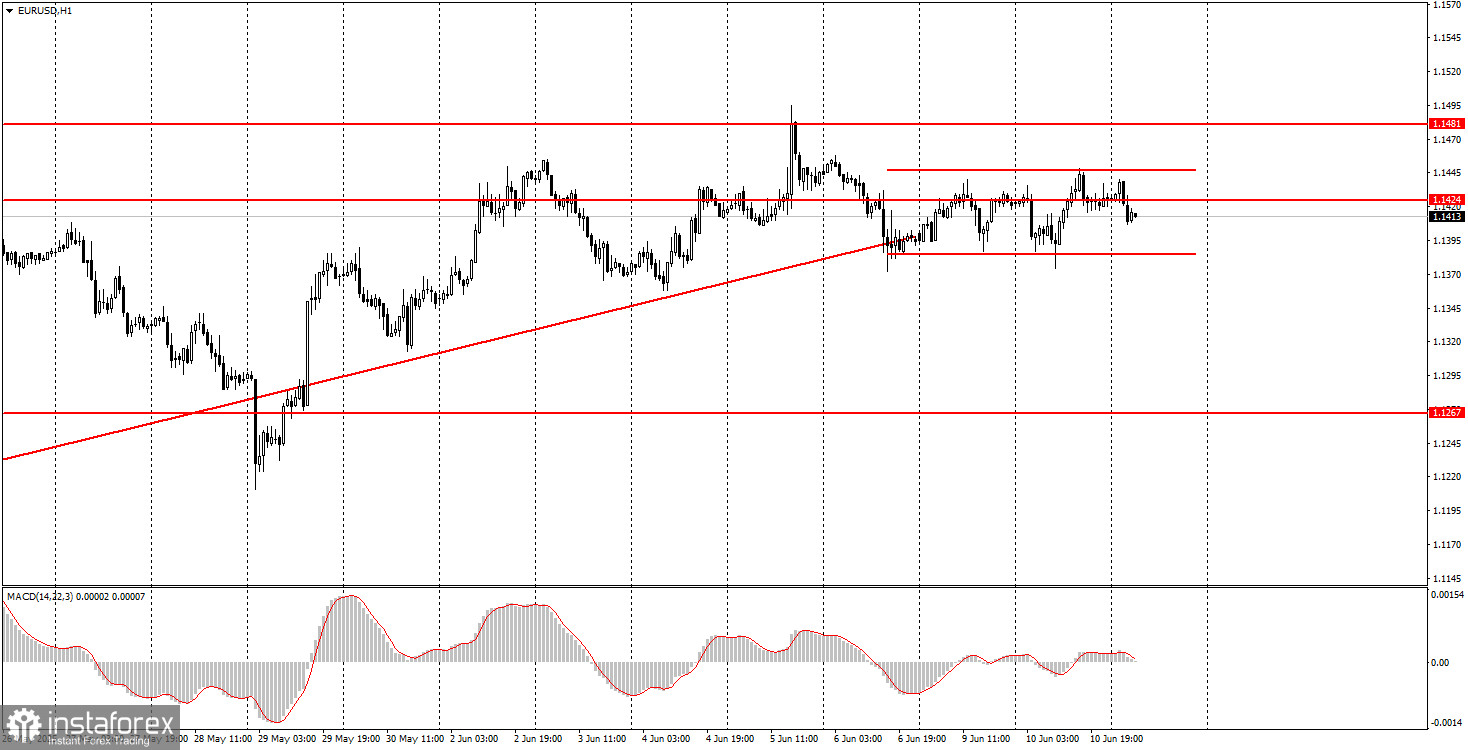
On Tuesday, the EUR/USD currency pair again showed no intention of actively trading. Over the past three days, a sideways channel has formed on the hourly time frame, and the pair's volatility remains very low. On the one hand, this is understandable — there has been no macroeconomic backdrop during these days, and the market is not reacting to news related to civil unrest in the U.S., its suppression, or the trade negotiations between the U.S. and China.
However, the unrest in the U.S. is unlikely to influence investor sentiment positively, and there have been no optimistic outcomes from the negotiations between Beijing and Washington — or at least, the market has not been given any concrete information. Donald Trump assures everyone that the deal will be signed and highly beneficial for America. At the same time, he states that reaching an agreement with China is very difficult. The market, however, has grown tired of Trump's optimistic rhetoric, which often goes unfulfilled and unsupported by actions. It's worth noting that no trade agreement has been signed to date.
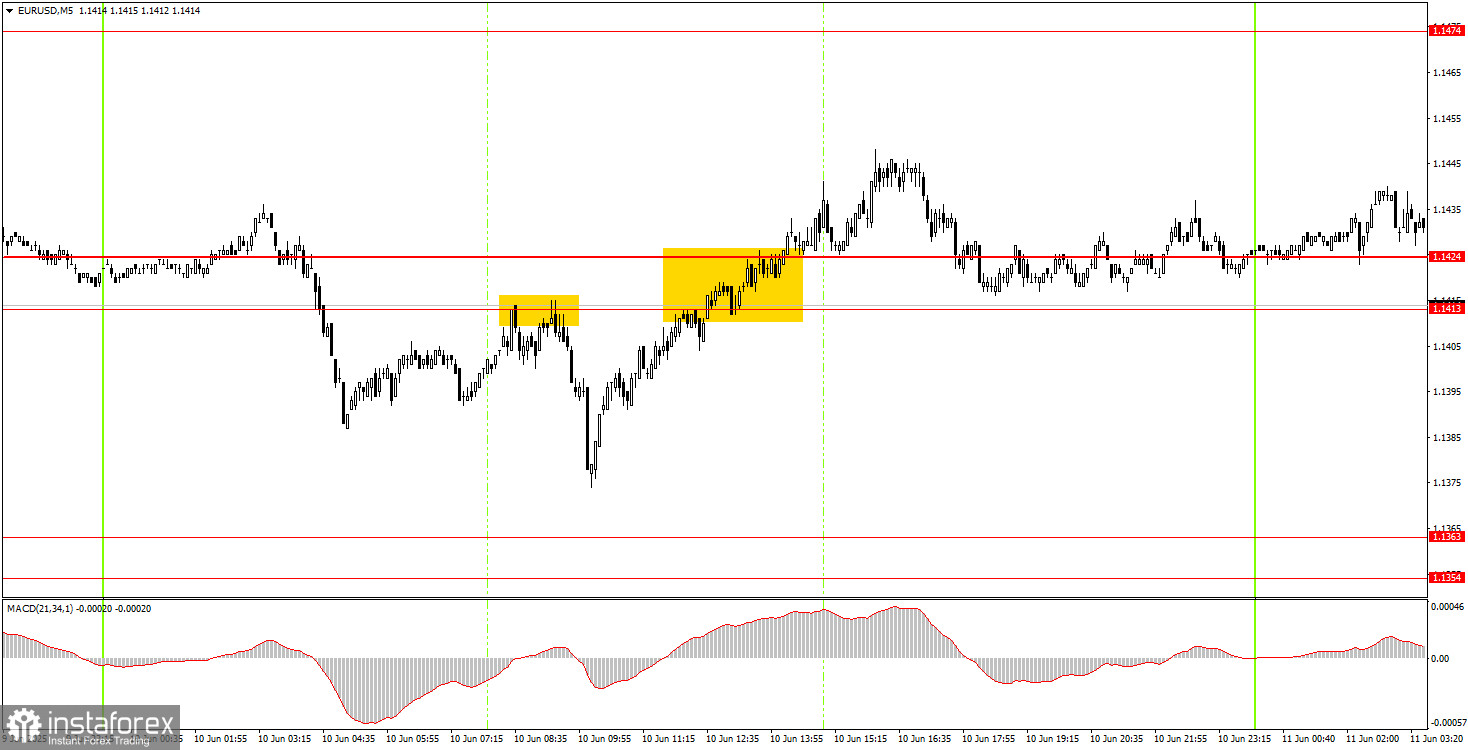
In the 5-minute time frame, two trading signals were formed on Tuesday. First, the pair bounced off the 1.1413–1.1424 zone and broke through it. The price moved downward by about 30 pips in the first case but failed to reach the nearest target. The second signal was even weaker — the price only moved about 15 pips in the correct direction. In both cases, it's likely that breakeven Stop Losses were triggered.
The EUR/USD pair has broken through the ascending trendline in the hourly chart. However, the upward trend that began during Trump's presidency remains intact. For now, the fact that Trump is President of the United States is reason enough for the market to sell the dollar consistently. Trump continues to issue threats, set ultimatums, impose or increase tariffs, and make other controversial decisions. As a result, even if the market is not actively selling the dollar right now, it is also not interested in buying it.
On Wednesday, the EUR/USD pair will again await Trump's news. If none appears, the sideways movement may continue. Trading can be based on technical levels and zones, but movements are weak and erratic within a flat market.
On the 5-minute TF, we should consider the levels of 1.0940-1.0952, 1.1011, 1.1088, 1.1132-1.1140, 1.1198-1.1218, 1,1267-1.1292, 1.1354-1.1363, 1.1413-1.1424, 1.1474-1.1481, 1.1513, 1.1548, 1.1571, 1.1607-1.1622. On Wednesday, the only notable event will be the U.S. inflation report. While it is an important report, it is unlikely to shift market sentiment significantly. The dollar might strengthen, but any gains will likely be short-lived and modest.
Support and Resistance Levels: These are target levels for opening or closing positions and can also serve as points for placing Take Profit orders.
Red Lines: Channels or trendlines indicating the current trend and the preferred direction for trading.
MACD Indicator (14,22,3): A histogram and signal line used as a supplementary source of trading signals.
Important Events and Reports: Found in the economic calendar, these can heavily influence price movements. Exercise caution or exit the market during their release to avoid sharp reversals.
Forex trading beginners should remember that not every trade will be profitable. Developing a clear strategy and practicing proper money management are essential for long-term trading success.


