See also

 11.06.2025 06:41 PM
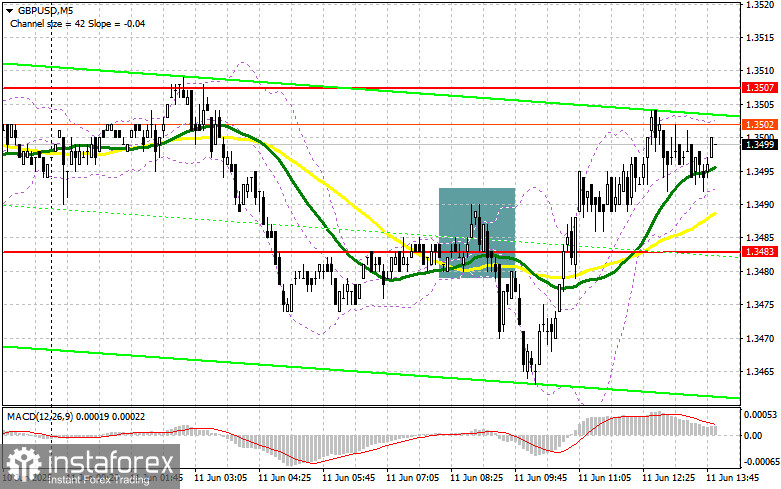
In my morning forecast, I drew attention to the 1.3483 level and planned to make trading decisions based on it. Let's look at the 5-minute chart and analyze what happened. A rise and the formation of a false breakout at that level led to a short entry, resulting in a 20-point drop. The technical picture was revised for the second half of the day.
To Open Long Positions on GBP/USD:
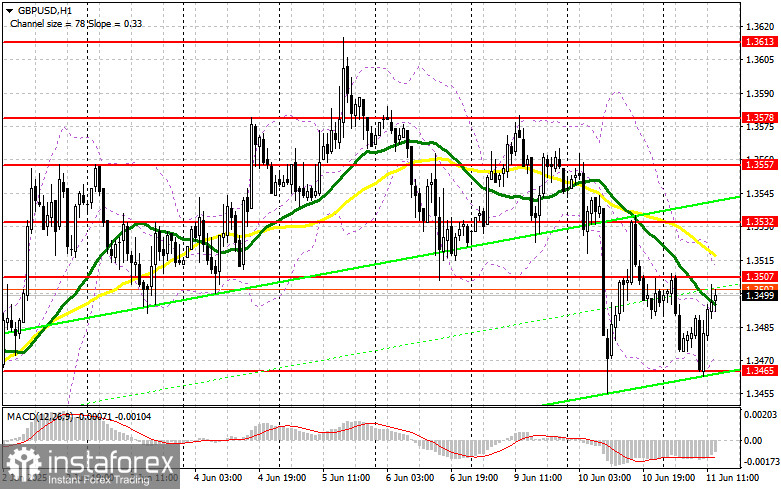
U.S. CPI data for May could pose significant challenges for pound buyers — but only if inflation exceeds economists' forecasts. Otherwise, the pound has a chance to recover after the recent sell-off. In the case of strong data, I would prefer to act around the 1.3465 support level formed earlier today. A false breakout at that level would provide a good long entry with a target of returning to the 1.3507 resistance. A breakout and retest of this range from top to bottom would serve as a new long entry signal with the prospect of a move to 1.3532. The furthest target is the 1.3557 level, where I plan to take profit.
If GBP/USD declines and there is no bullish activity around 1.3465 in the second half of the day, pressure on the pound may increase significantly. In that case, only a false breakout around 1.3429 would be a valid condition to open long positions. I plan to buy GBP/USD on a direct rebound from 1.3391, targeting a 30–35 point intraday correction.
To Open Short Positions on GBP/USD:
Sellers could return at any moment on the back of strong U.S. statistics. If the pair rises, it's crucial for bears to prevent buyers from breaking above 1.3507. A false breakout there would be enough to enter short positions, aiming for a decline to the 1.3465 support level. A breakout and retest of this range from bottom to top would likely trigger stop-losses and open the path toward 1.3429. The furthest downward target is 1.3391, where I plan to take profit.
If demand for the pound returns in the second half of the day and bears remain inactive around 1.3507 — where the moving averages currently favor sellers — a broader upward correction may occur. In this case, it would be better to wait for a test of the 1.3532 resistance before selling. I'll open short positions there only on a failed breakout. If there's no downward movement there either, I'll look to sell on a rebound from the 1.3557 level, but only for a 30–35 point intraday correction.
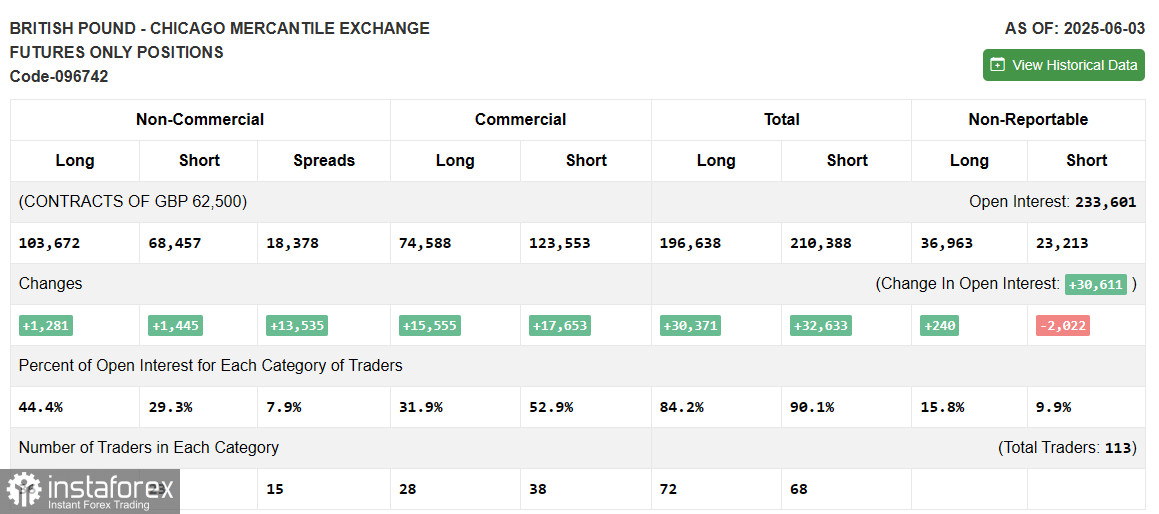
In the Commitment of Traders (COT) report for June 3, both long and short positions increased, but the growth was relatively balanced and did not result in a major shift in market sentiment. Market participants are waiting for new UK economic data, especially related to growth and inflation, which could significantly influence the Bank of England's plans regarding interest rates. Additionally, U.S. inflation data is expected this week, which may also impact market sentiment.
The latest COT report showed that long non-commercial positions rose by 1,281 to 103,672, while short positions increased by 1,445 to 68,457. As a result, the gap between long and short positions widened by 13,535.
Indicator Signals:
Moving AveragesTrading is taking place below the 30- and 50-period moving averages, indicating continued pressure on the pound.
Note: The author uses hourly (H1) chart data, which differs from the classical daily (D1) moving average definitions.
Bollinger BandsIn the event of a decline, the lower boundary of the indicator near 1.3465 will serve as support.
Indicator Descriptions:


