See also

 12.06.2025 04:40 AM
The U.S. inflation data released on Wednesday stirred the markets: the dollar index dropped by 0.47%, WTI oil surged by 5.54%, gold rose by 1.27%, and 5-year U.S. Treasury yields fell from 4.08% to 4.01%. The core CPI for May remained unchanged at 2.8% y/y, falling short of the 2.9% y/y forecast, while the headline CPI rose from 2.3% to 2.4% y/y, below the 2.5% forecast. Investors interpreted these figures as potentially influencing the Federal Reserve toward easing its policy, all while preserving a semblance of independence. While Fed funds futures still suggest a rate cut in September, the bond market appears to be pricing in such a move as early as the upcoming June 18 meeting, as yield curve inversions are becoming more widespread. This is enough to sustain euro-buying interest for at least another week.
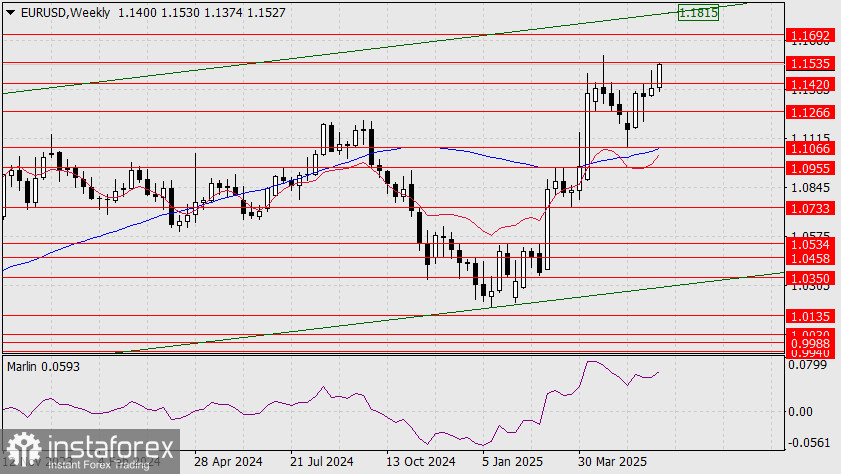
According to the weekly chart, we expect EUR/USD to rise first toward the target level at 1.1692, followed by a move to 1.1815, the September 2018 high, which aligns with the upper boundary of the price channel.
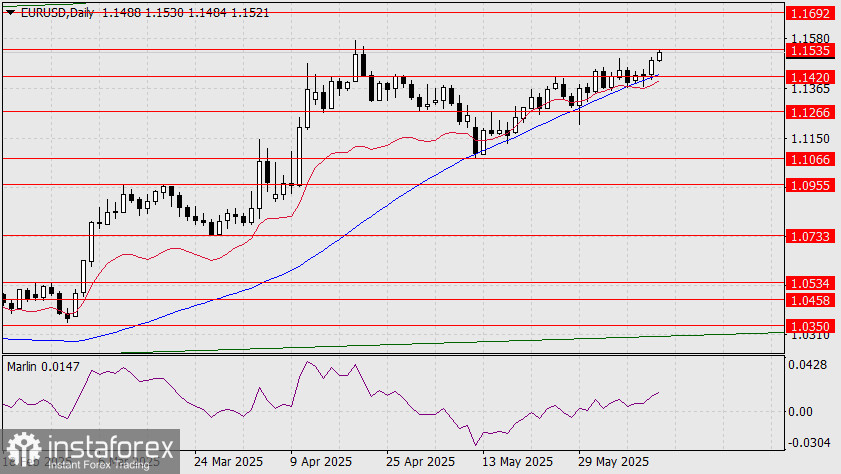
The daily chart shows the price testing the first resistance at 1.1535. A minor pause may occur after breaking above this level, as it is near the April 21 high, and some consolidation is likely before continuation. Beyond that, we expect a rally toward 1.1692.

On the H4 chart, the price broke above both indicator lines and is growing steadily, while the Marlin oscillator broke out of consolidation to the upside. The initial bullish momentum has already occurred.
You have already liked this post today
*The market analysis posted here is meant to increase your awareness, but not to give instructions to make a trade.


