See also

 16.06.2025 07:18 PM
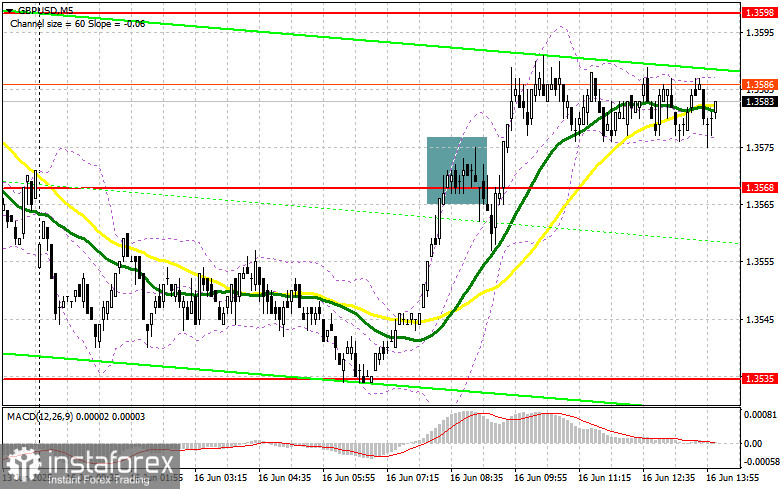
In my morning forecast, I focused on the 1.3568 level and planned to base market entry decisions on it. Let's take a look at the 5-minute chart and see what happened. An upward movement and a false breakout formed at that level, resulting in a sell entry for the pound, but there was no significant downward movement. The technical picture was revised for the second half of the day.
To open long positions on GBP/USD:
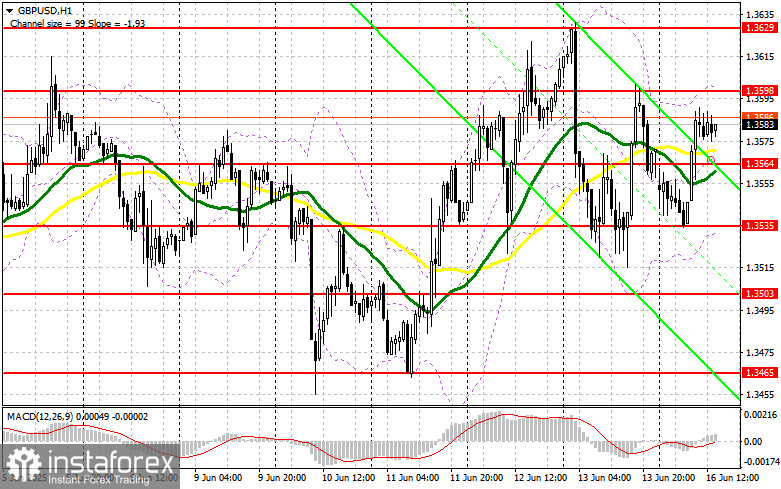
The Empire Manufacturing Index is the only notable release expected in the second half of the day. I don't believe this data will significantly impact the market, so it's better to focus on geopolitical news. In the event of a decline in GBP/USD, I prefer to act near the new support at 1.3562, formed during the first half of the day. A false breakout there will provide a good entry point for long positions with the goal of returning to resistance at 1.3598, which was not reached earlier. A breakout and retest from top to bottom of this range will create a new entry point for long positions with the potential to update 1.3629. The final target will be the 1.3657 area, where I plan to take profit.
If GBP/USD falls and bulls show no activity at 1.3564 in the second half of the day, pressure on the pound may increase. In this case, only a false breakout around 1.3535 would be a suitable condition for opening long positions. I plan to buy GBP/USD on a rebound from the 1.3503 support area, targeting a 30–35 point intraday correction.
To open short positions on GBP/USD:
Sellers did everything they could, but a proper downward move never materialized. The main focus for the second half of the day will remain at the 1.3598 level. A false breakout there would be enough for a sell entry, targeting support at 1.3564, where the moving averages are currently positioned in favor of the bulls. A breakout and retest from the bottom up of this range will trigger stop-loss orders and open the path to 1.3535. The final target will be the 1.3503 area, where I plan to take profit.
If demand for the pound returns in the second half of the day and bears fail to act around 1.3598, a larger GBP/USD rally is not ruled out. In that case, it's better to delay selling until the resistance at 1.3629 is tested. I will open short positions there only after a failed consolidation. If there's no downward movement even at that level, I will look to sell on a rebound from 1.3657, aiming for a 30–35 point correction.
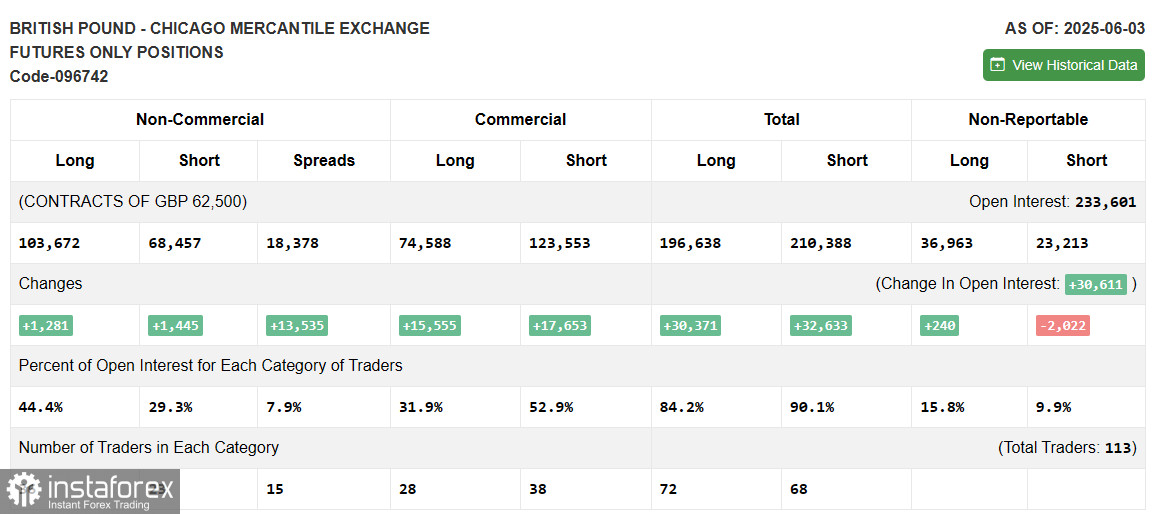
COT Report (Commitments of Traders) – June 3:
There was a balanced increase in both long and short positions, which didn't result in significant changes in market sentiment. Market participants are waiting for new fundamental data from the UK, especially related to economic growth and inflation, which could strongly influence the Bank of England's plans to maintain current interest rates. Additionally, US inflation data is expected this week, which could also impact market sentiment—there's plenty to analyze.
According to the latest COT report, long non-commercial positions rose by 1,281 to 103,672, while short non-commercial positions increased by 1,445 to 68,457. As a result, the gap between long and short positions widened by 13,535.
Indicator Signals:
Moving Averages:
Trading is taking place just above the 30- and 50-day moving averages, indicating market uncertainty.
Note: The author analyzes moving averages on the H1 hourly chart, which differs from the classical daily averages on the D1 chart.
Bollinger Bands:
In the event of a decline, the lower band around 1.3535 will act as support.
Indicator Descriptions:


