See also

 20.06.2025 03:31 PM
In my morning forecast, I highlighted the 1.3475 level and planned to make trading decisions based on it. Let's look at the 5-minute chart and examine what happened. A decline followed by a false breakout at this level led to a buying entry point for the pound, resulting in a 25-point rally. The technical outlook was revised for the second half of the day.
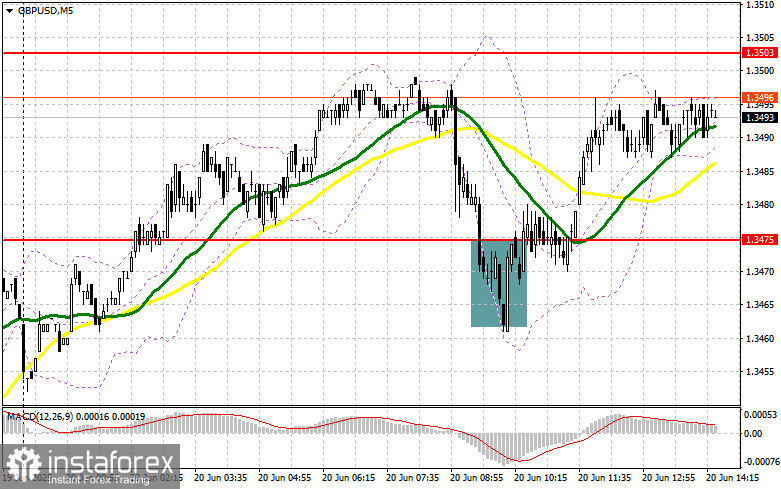
A sharp drop in UK retail sales caused a decline in the British pound, but it didn't trigger a large sell-off. The Philadelphia Fed Manufacturing Index and the Leading Indicators Index are the only releases during the U.S. session, so a significant pickup in dollar demand is unlikely. At the same time, the pound is unlikely to stage a decisive move either, so it's better to focus on range trading.
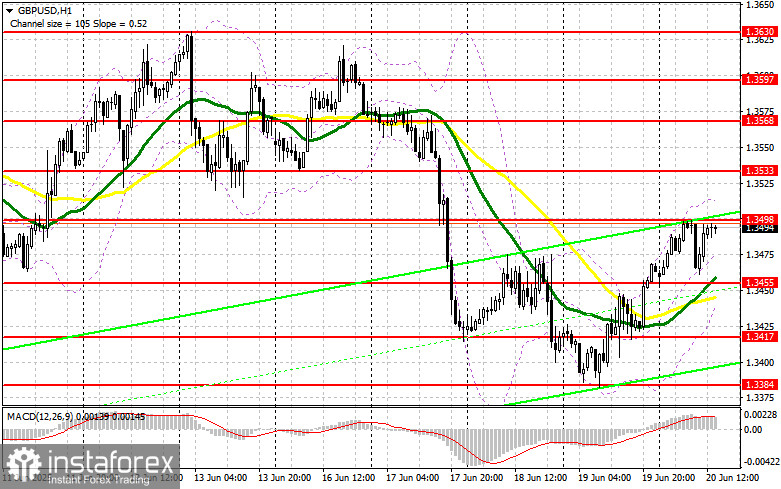
If GBP/USD declines, I would prefer to act around the new support at 1.3455, formed earlier today. A false breakout there will provide a good entry point for long positions, targeting a return to the 1.3498 resistance. A breakout with a successful retest from above would open the way for new long entries, aiming for a move toward 1.3533. The ultimate target will be 1.3568, where I plan to take profit.
If GBP/USD declines and there is no buyer activity near 1.3455 in the second half of the day, pressure on the pound may increase significantly. In that case, only a false breakout around 1.3417 will be a suitable condition to buy. I plan to open long positions on a rebound from the 1.3384 support level, targeting a 30–35 point intraday correction.
Sellers took advantage of weak data, but the bearish momentum didn't gain traction. If GBP/USD rises in the second half of the day, only a false breakout around 1.3498 would offer an entry point for short positions, targeting a drop toward the 1.3455 support, where the moving averages—favoring the bulls—are located. A breakout and retest of this level from below would trigger stop-loss orders, opening the path to 1.3417. The ultimate target would be 1.3384, where I plan to take profit.
If demand for the pound returns later in the day and bears fail to act around 1.3498, a larger GBP/USD rally cannot be ruled out. In this case, it's better to delay selling until a test of the 1.3533 resistance. I will open short positions there only after a failed breakout. If there is no downward movement at that point either, I'll look for short entries on a rebound near 1.3568, targeting a 30–35 point correction.
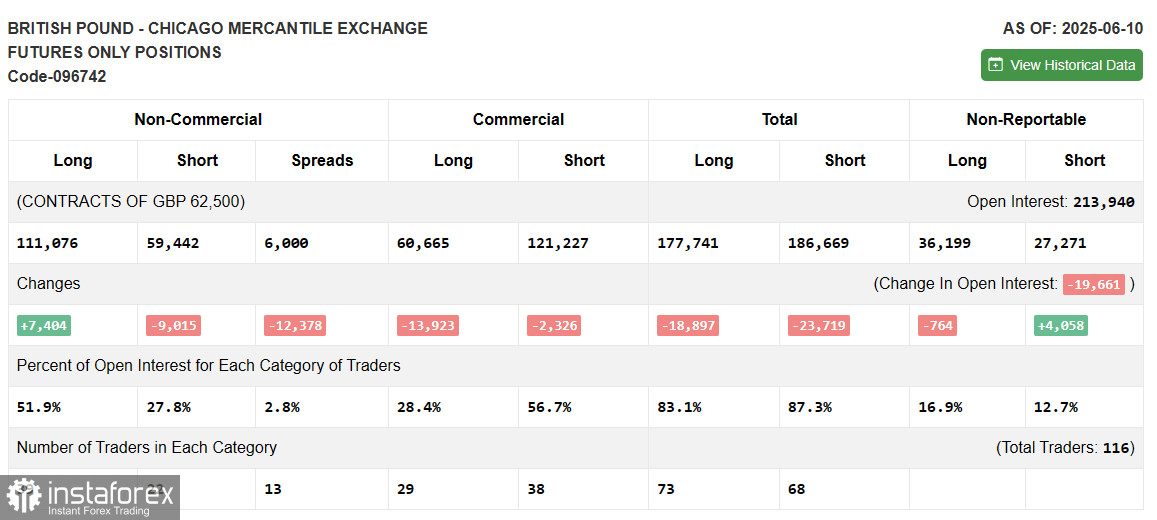
The Commitment of Traders (COT) report for June 10 showed an increase in long positions and a decline in shorts. Despite clear signs that the Federal Reserve is keeping interest rates unchanged, reports of a significant drop in U.S. inflation failed to provide notable support for the dollar, boosting demand for the British pound.
A key factor for the dollar's future performance will be Jerome Powell's interpretation of the inflation situation and his forecast regarding possible rate cuts in the fall. These statements will determine the future direction of the GBP/USD pair, which is currently showing steady growth.
The latest COT report indicated that non-commercial long positions rose by 7,404 to 111,076, while non-commercial short positions fell by 9,015 to 59,442. As a result, the gap between long and short positions narrowed by 12,378.
Moving Averages Trading is taking place above the 30- and 50-period moving averages, which indicates a potential continuation of pound strength.
Note: The period and prices of the moving averages are considered by the author on the H1 hourly chart and differ from the traditional daily moving averages on the D1 chart.
Bollinger Bands In the event of a decline, the lower band near 1.3435 will act as support.


