See also

 23.06.2025 11:14 AM
GBP/USD
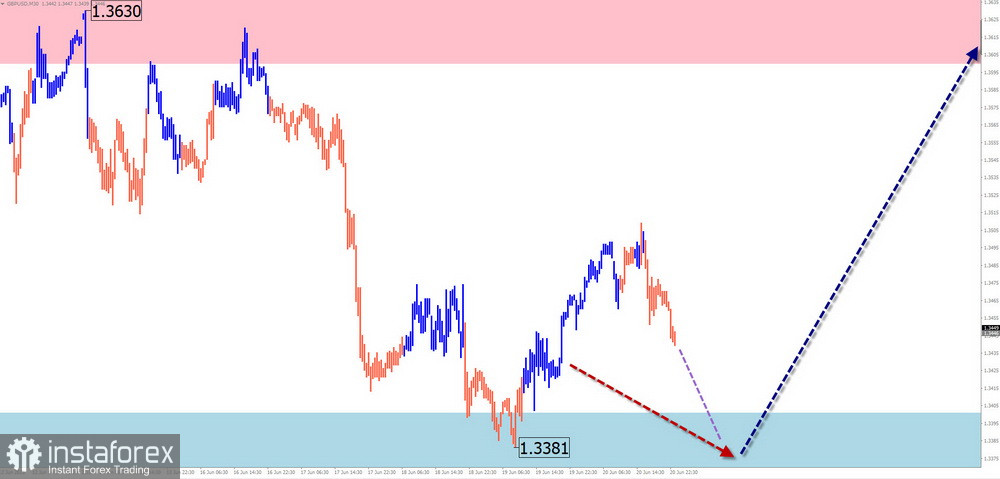
Analysis:Since April, the short-term price trend of the British pound's main pair has followed a bullish wave. As of today, the wave structure remains incomplete. From the end of May, the price has been pulling back from a major potential reversal zone on the weekly scale. The downward potential remains within correctional boundaries.
Forecast:A continuation of the pullback toward the calculated support is likely. After reaching this zone, sideways consolidation is expected, creating the groundwork for a rebound. The next upward leg is likely to be limited by the calculated resistance.
Potential Reversal Zones
Recommendations:
AUD/USD
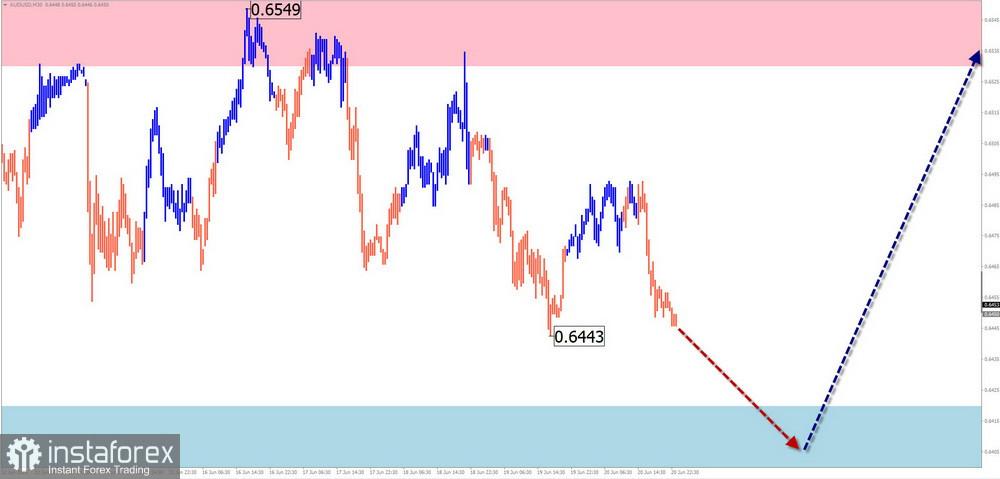
Analysis:Over the past three months, price swings in the AUD/USD pair have followed a bullish wave. The current downward phase from May 26 likely represents a correction. The price has bounced off the lower boundary of a potential reversal zone on the daily timeframe.
Forecast:The bearish sentiment could conclude within the next few days near the calculated support. A reversal phase is then likely to develop. The extent of the anticipated upward movement is shown by the resistance range.
Potential Reversal Zones
Recommendations:
USD/CHF
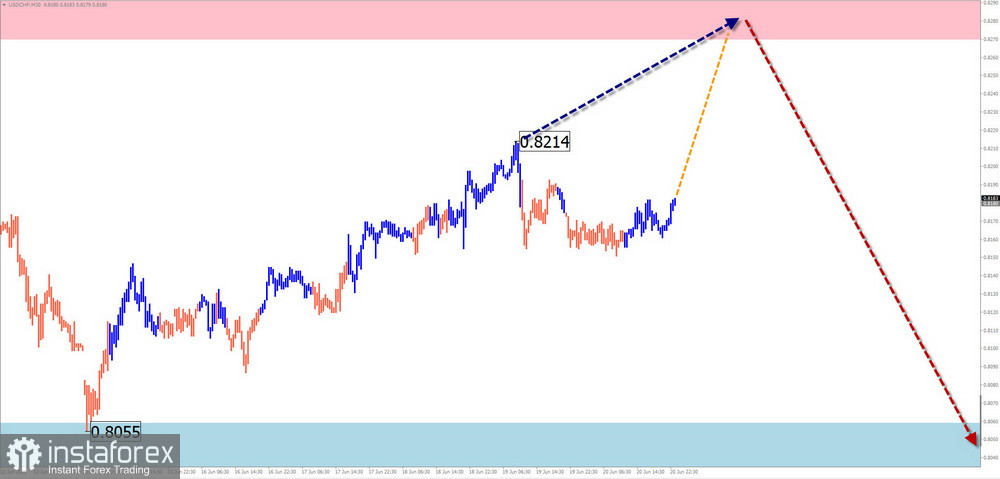
Analysis:
Since the start of the year, USD/CHF has been forming a bearish wave. Over the past two months, a counter-trend correction has taken shape. Currently, the pair is approaching the upper boundary of a potential reversal zone on the hourly chart. The correction is still incomplete.
Forecast:Early in the week, price may rise and test the resistance zone. A brief breakout above this area is possible. In the second half of the week, a reversal and resumption of the downtrend is likely. The calculated support shows the lower limit of the expected weekly range.
Potential Reversal Zones
Recommendations:
EUR/JPY
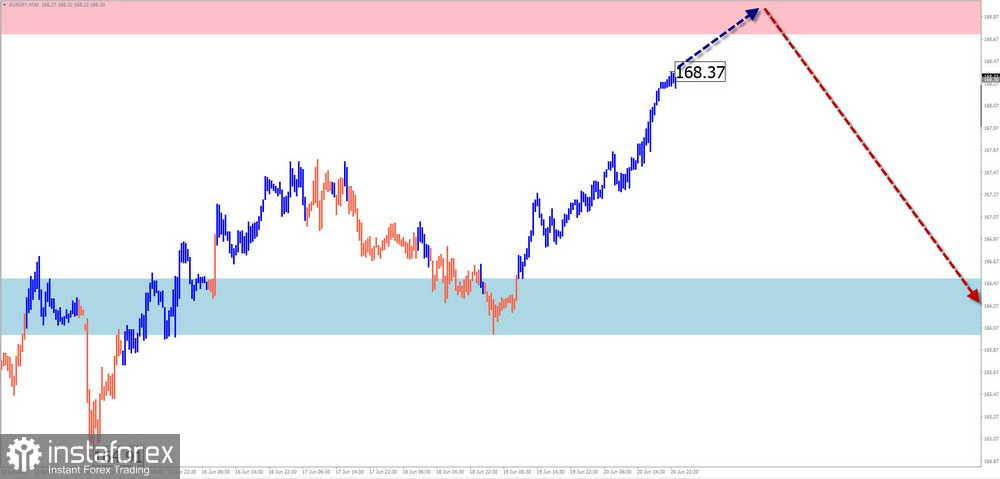
Analysis:EUR/JPY continues to move upward. Last week, the price approached the lower boundary of a significant weekly potential reversal zone. No reversal signals are currently observed on the chart.
Forecast:A further rise is expected at the start of the week. Near the calculated resistance, conditions for a reversal may form, transitioning the pair into a downward phase. The support zone marks the expected lower boundary of the weekly range.
Potential Reversal Zones
Recommendations:
EUR/GBP
Analysis:Since early April, EUR/GBP has been in a downward wave. The current structure indicates the formation of a correction phase (B), which remains incomplete and appears as a drawn-out flat correction.
Forecast:A continuation of the upward correction is expected early in the week, with a potential reversal occurring near the calculated resistance. A downward move may begin in the latter half of the week.
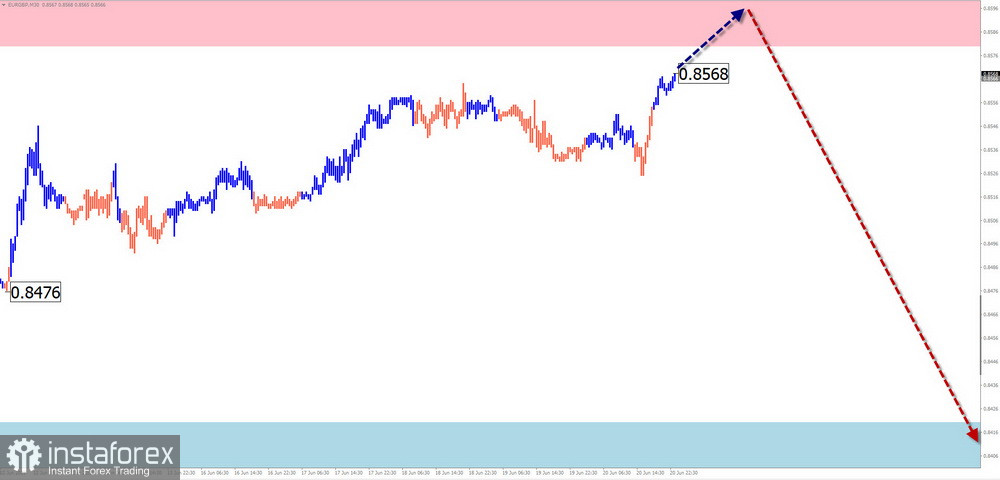
Potential Reversal Zones
Recommendations:
US Dollar Index ($ Index)
Analysis:Recent movements in the US Dollar Index follow a bullish wave, representing a correction within a broader bearish trend on the higher timeframe. The current wave forms a contracting horizontal pattern, lacking a final segment.
Forecast:The general bullish direction is expected to continue this week. A short-term decline toward support is possible in the early days. Volatility is likely to increase later in the week. The calculated resistance marks the upper limit of a major reversal zone.
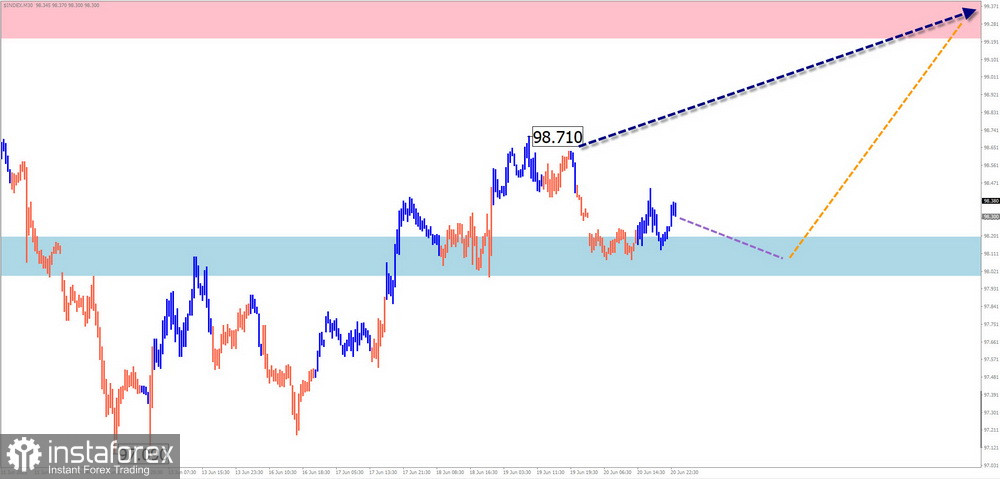
Potential Reversal Zones
Recommendations:Trades aimed at weakening national currencies in major pairs may be profitable this week. If reversal signals appear near resistance, such positions should be closed.
Notes: In simplified wave analysis (SWA), all waves consist of 3 parts (A-B-C). The analysis focuses on the last, unfinished wave on each timeframe. Dashed lines represent expected price movements.
Important: The wave algorithm does not take into account the time duration of market movements!


