See also

 30.06.2025 10:44 AM
This week, the price may start to decline from the 1.3719 level (closing of the last weekly candle), targeting 1.3620 — the 23.6% retracement level (red dashed line). Upon testing this level, the price may rebound upward toward 1.3677 — the 14.6% retracement level (red dashed line).
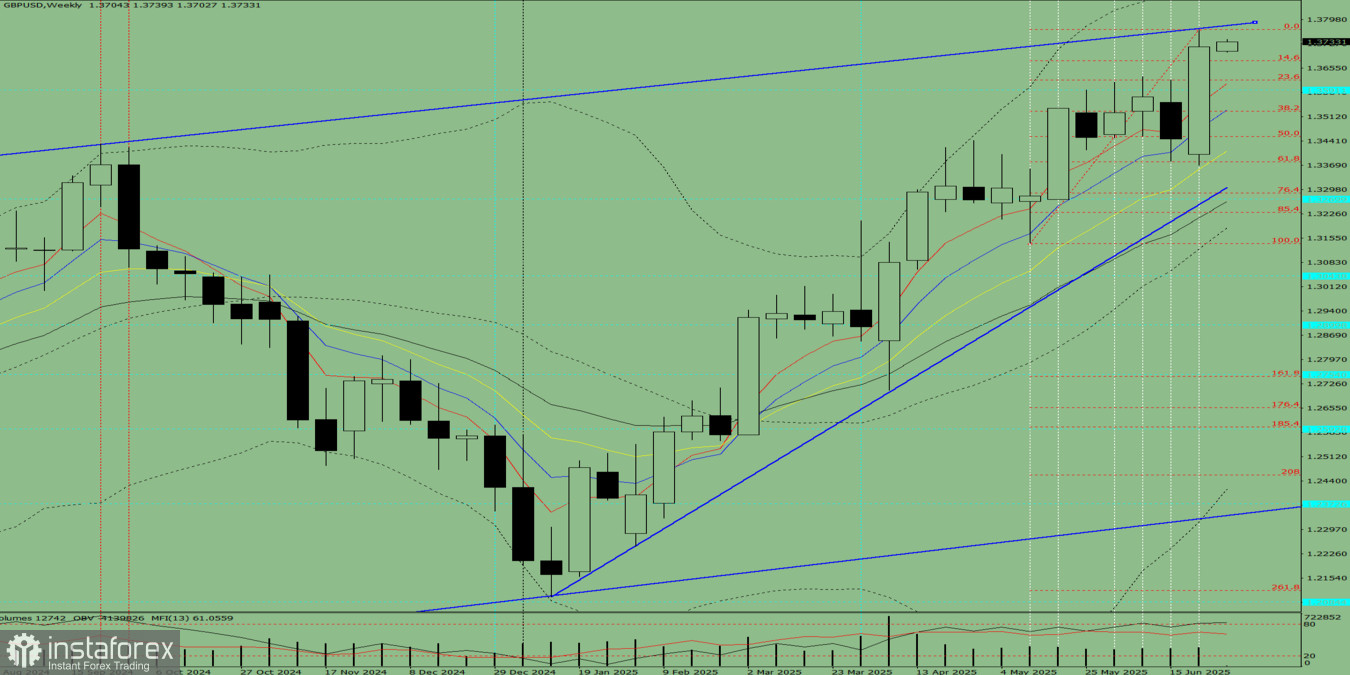
Fig. 1 (Weekly Chart)
Conclusion based on comprehensive analysis: downward movement
The price is most likely to exhibit a bearish trend throughout the week, with no upper shadow on the weekly black candle (indicating downward movement on Monday) and a lower shadow by Friday (indicating a possible rebound at the end of the week).
From the 1.3719 level (closing of the last weekly candle), the price may begin a downward movement toward 1.3591 — the historical support level (blue dashed line). Upon reaching this level, a rebound upward is possible toward 1.3677 — the 14.6% retracement level (red dashed line).
You have already liked this post today
*The market analysis posted here is meant to increase your awareness, but not to give instructions to make a trade.


