See also

 30.06.2025 12:20 PM
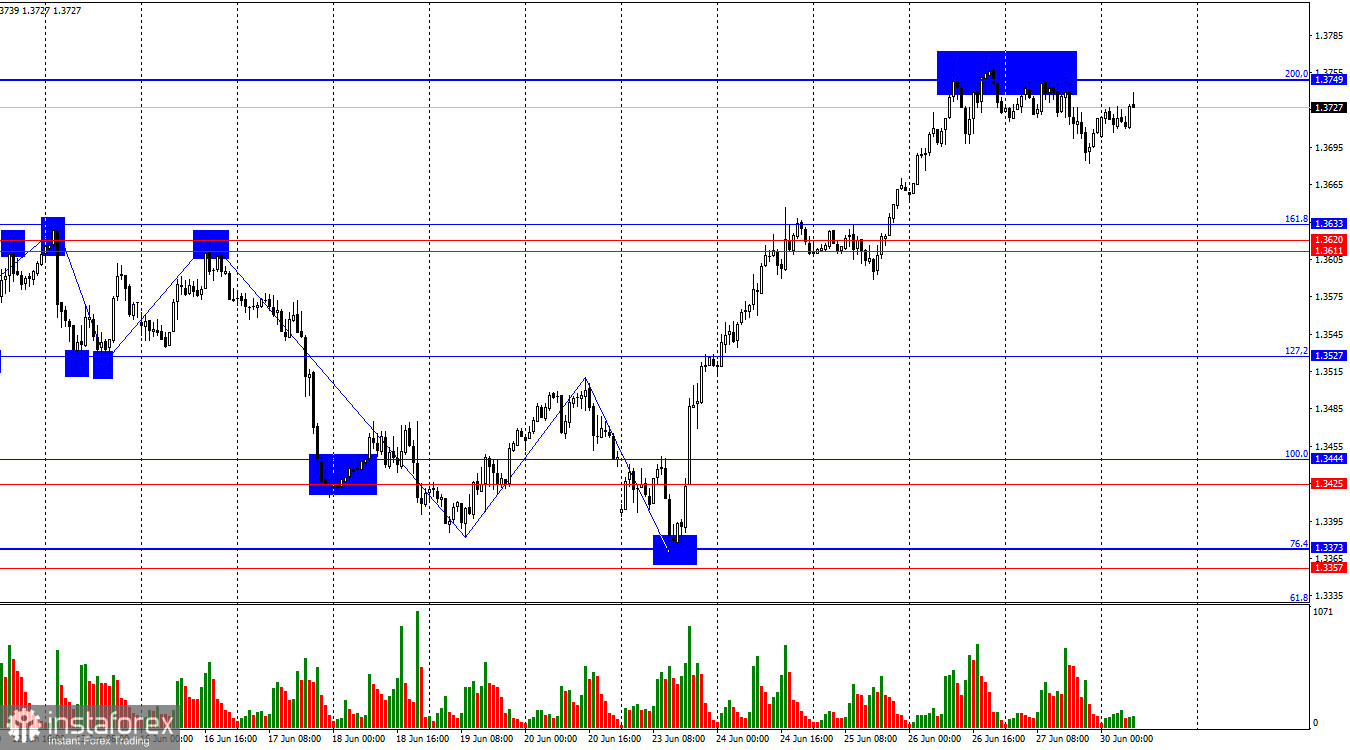
The wave pattern continues to suggest a bullish trend. The last completed downward wave only slightly broke the low of the previous wave, while the new upward wave easily surpassed the previous peak. Bearish traders are once again retreating, as the Middle East conflict has been resolved and the U.S. dollar still lacks substantial support factors. Trump's trade war continues to negatively affect the U.S. currency.
On Friday, several U.S. reports on income, spending, and consumer prices failed to spark any trader interest. This morning, the final Q1 GDP report for the UK was published. The economy grew by 1.3% year-over-year and by 0.7% quarter-over-quarter. These figures can be considered positive for the pound, but traders were already prepared for them, as the previous two estimates showed identical results. No other major reports or events are expected today, so sideways movement may continue on Monday. Later in the week, however, there will be more events and economic data, so the pause is likely to be short-lived. The saga over Jerome Powell's potential dismissal may continue to escalate, further undermining traders' willingness to deal with the dollar. The U.S. president and the FOMC chair cannot find common ground, even though the law does not require them to agree on monetary policy. Nonetheless, Trump continues to pressure Powell, showing little regard for legal constraints.
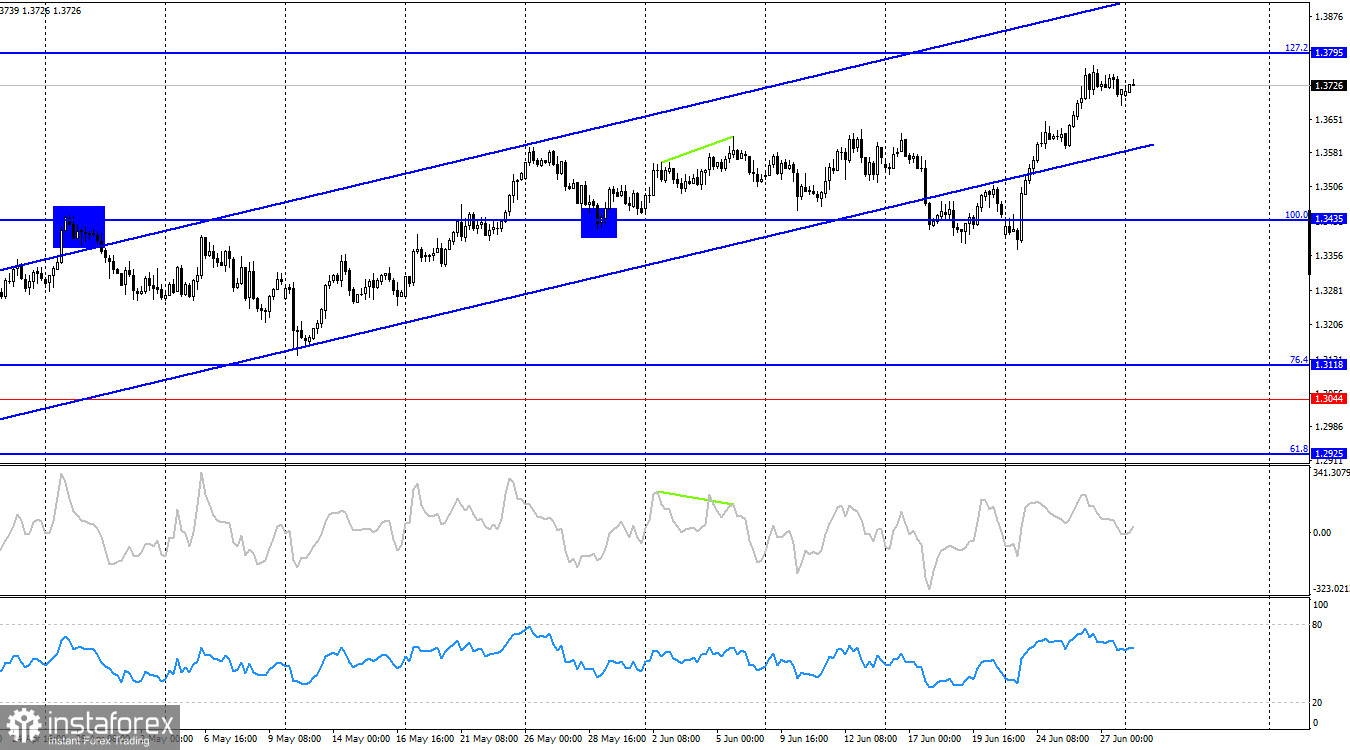
On the 4-hour chart, the pair continues to rise toward the 127.2% retracement level at 1.3795. A close above this level would open the way for further growth toward 1.4020. A bounce down from 1.3795 would favor the U.S. dollar and a decline within the upward trend channel, which remains valid. No emerging divergences are observed on any indicator.
Commitments of Traders (COT) Report:
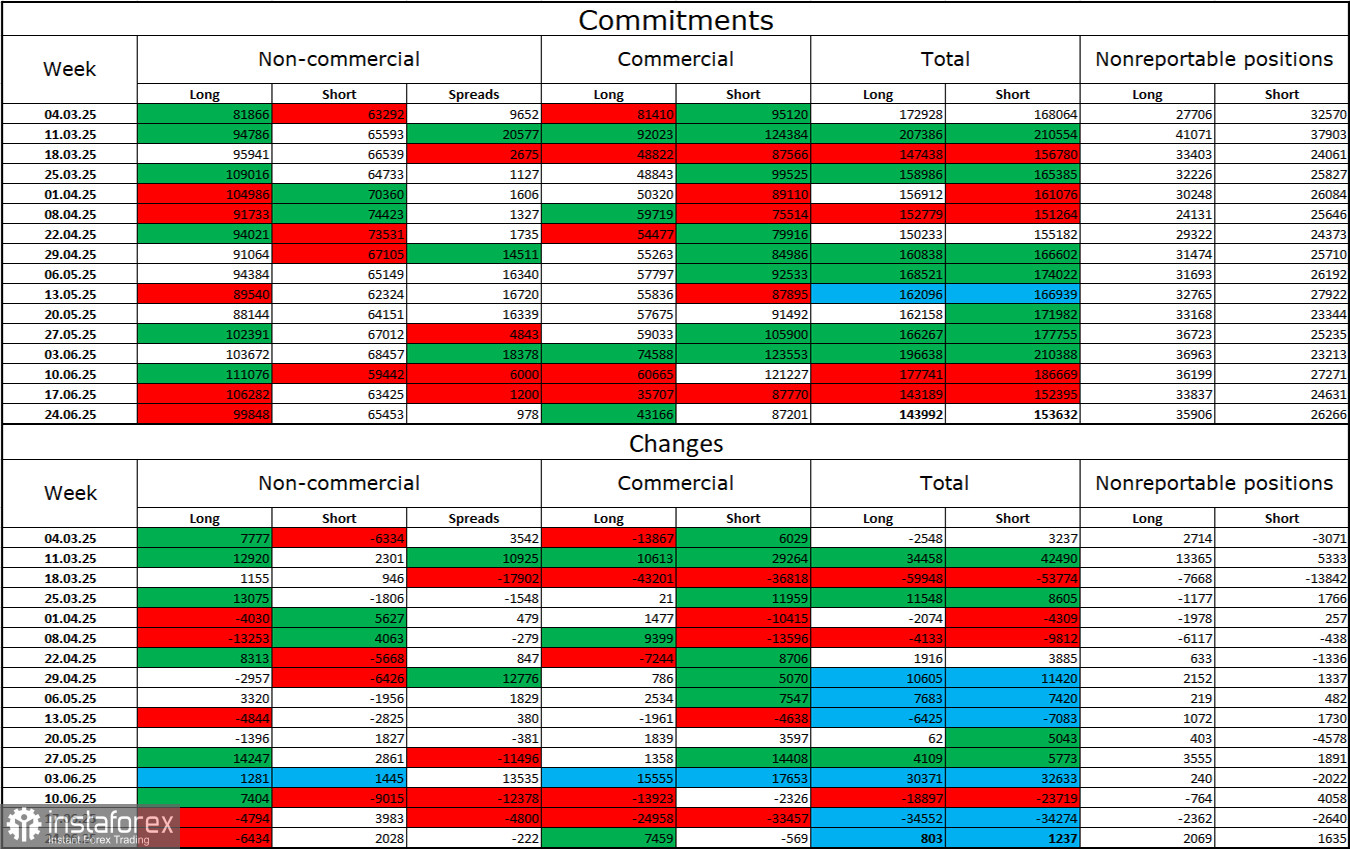
The sentiment among the "Non-commercial" trader category became slightly less bullish over the latest reporting week. The number of long positions held by speculators decreased by 6,434, while short positions increased by 2,028. However, bears have long lost their market advantage and currently stand no chance of success. The gap between long and short positions remains at 35,000 in favor of the bulls: 100,000 versus 65,000.
In my view, the pound still faces the risk of a decline, but developments in 2025 have shifted the market's long-term outlook. Over the past three months, the number of long positions has increased from 65,000 to 100,000, while short positions have fallen from 76,000 to 65,000. Under Donald Trump, confidence in the dollar has weakened, and the COT reports show that traders lack the desire to buy the U.S. currency. Therefore, regardless of the overall news background, the dollar continues to fall due to the political situation surrounding Donald Trump.
News Calendar for the U.S. and UK:
On Monday, the economic calendar includes just one event, which has already been released. Thus, the information background will not influence trader sentiment throughout the day.
GBP/USD Forecast and Trading Advice:
Selling the pair is possible today following a bounce down from 1.3749, with a target at 1.3611–1.3633. I previously recommended buying above the 1.3425–1.3444 level, targeting 1.3527, the 1.3611–1.3633 level, and 1.3749. All those targets have been met, and a breakout above 1.3749 opens the way for buying with a target of 1.3845.
The Fibonacci level grids are built from 1.3446–1.3139 on the hourly chart and from 1.3431–1.2104 on the 4-hour chart.


