See also

 02.07.2025 05:12 AM
On the daily chart, the signal line of the Marlin oscillator is moving downward in a straight line, ignoring the 120-pip price range.
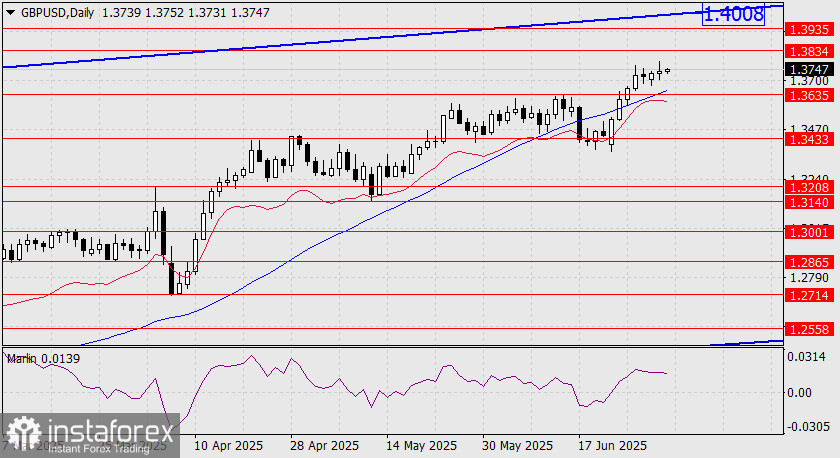
This suggests that the pair is freely drifting within the nearby target range of 1.3635–1.3834. A breakout beyond either boundary will become the guiding factor for the next price movement. Upside targets: 1.3935, 1.4008. Downside targets: 1.3433, 1.3140–1.3208.
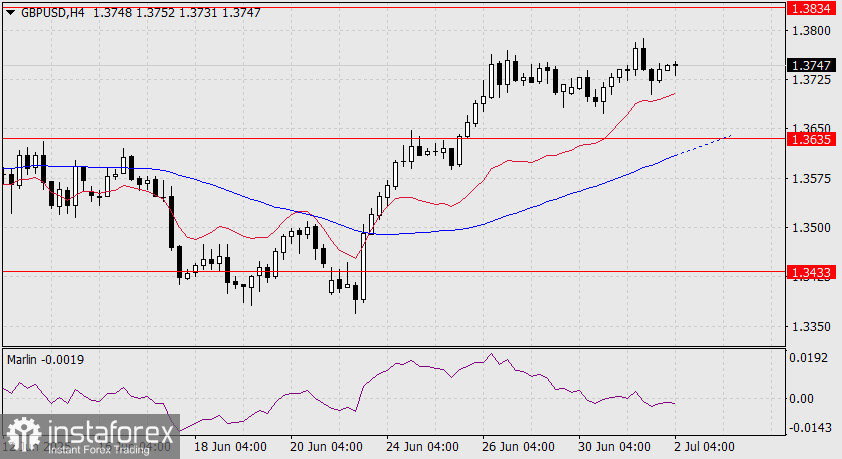
On the four-hour chart, the Marlin oscillator's signal line is now firmly positioned in the bearish zone. The price is likely preparing to test support at 1.3635.
In six candles' time, i.e., by tomorrow morning, the MACD line will reach the 1.3635 level, significantly reinforcing it. If the price breaks below this level, the downward trend could gain medium-term potential.
You have already liked this post today
*The market analysis posted here is meant to increase your awareness, but not to give instructions to make a trade.


