See also

 14.07.2025 11:25 AM
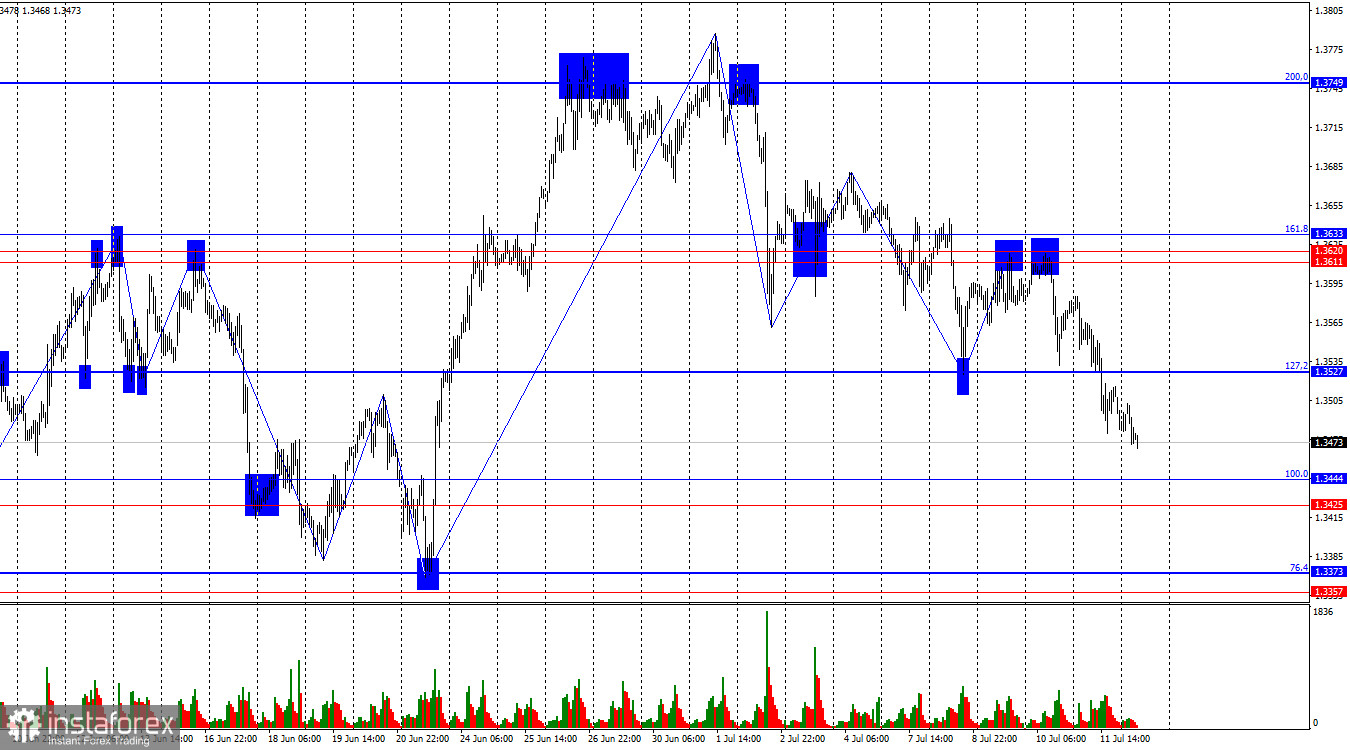
On the hourly chart, the GBP/USD pair on Friday consolidated below the 127.2% Fibonacci level at 1.3527 and continued its decline toward the next retracement level of 100.0% at 1.3444. A rebound from this level would favor the British pound and suggest a moderate rise toward 1.3527. A close below 1.3444 would increase the likelihood of a continued decline toward the next retracement level at 1.3373.
The wave situation still indicates the preservation of a bullish trend. The most recent completed upward wave broke above the high of the previous wave, and the following three downward waves have not formed a new low. Thus, what we are observing is not a trend reversal to bearish but rather a series of waves within a strong correction — the strongest one in quite some time. Bears still lack strong fundamental reasons to take the lead, as Trump's trade war continues to escalate.
Throughout last week, the information landscape was dominated by a single topic — Donald Trump's tariffs. Therefore, the strengthening of the U.S. dollar appears at least somewhat strange. It seems that the bulls have taken a pause, and the British pound has entered a sharp correction phase. This is the only explanation I see for the dollar's growth amid the announcement of a new wave of trade tariffs. In my view, the U.S. dollar is unlikely to show strong and sustained growth, but one must always have a contingency plan in case these assumptions turn out to be wrong. As such, I am not currently opposed to selling the pound, but such trades appear risky to me.
The economic backdrop for the coming week is again expected to be weak, while bears have been attacking for two weeks already without support from news-driven factors. If even tariff-related news is not producing the usual trader reactions, other economic reports are unlikely to. I believe that further decline is likely in the near term, as the market seems to be forming a solid correction before the bullish trend resumes.
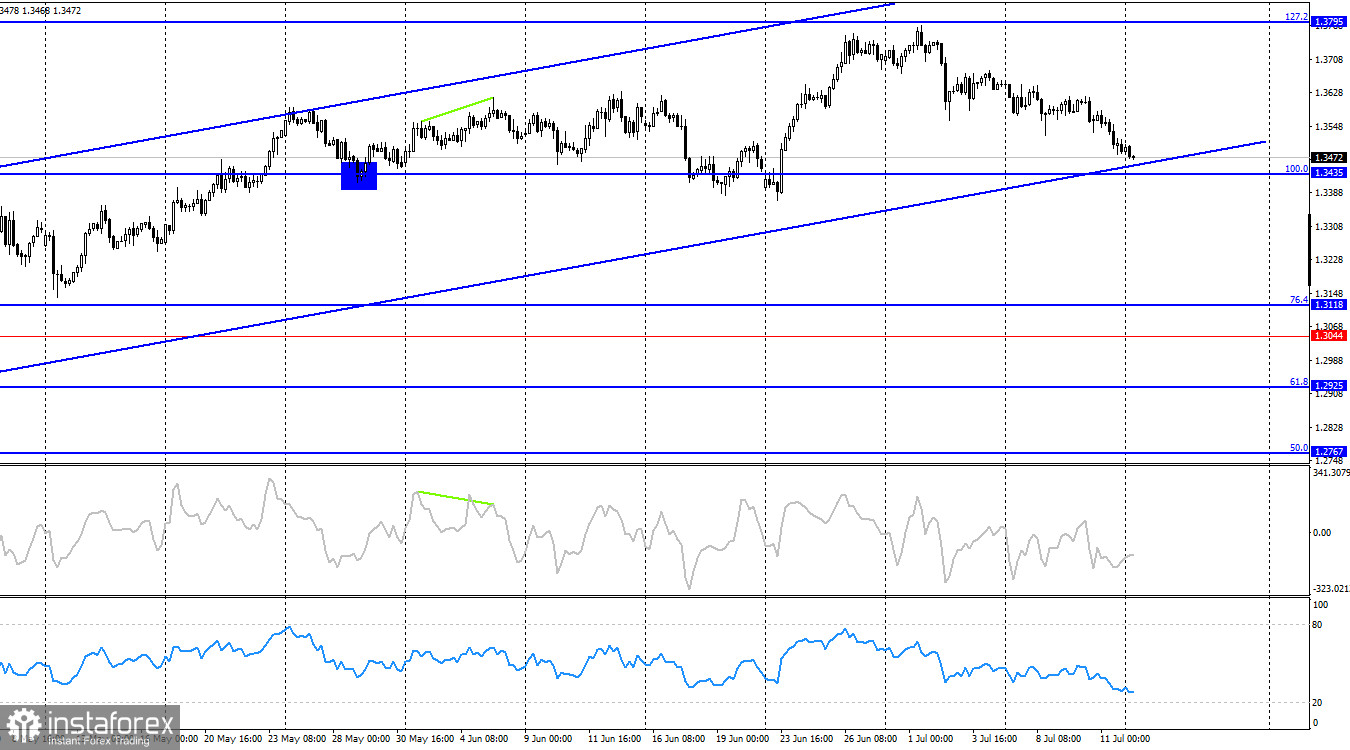
On the 4-hour chart, the pair reversed in favor of the U.S. dollar, falling just a few points short of the 127.2% retracement level at 1.3795. Since the decline was unexpected and could end quickly, I believe it's better to rely on the hourly chart for analysis at this time. A rebound from the lower boundary of the ascending channel and/or from the 100.0% Fibonacci level at 1.3435 would support a resumption of the bullish trend. No emerging divergences are observed on any indicators.
Commitments of Traders (COT) Report:
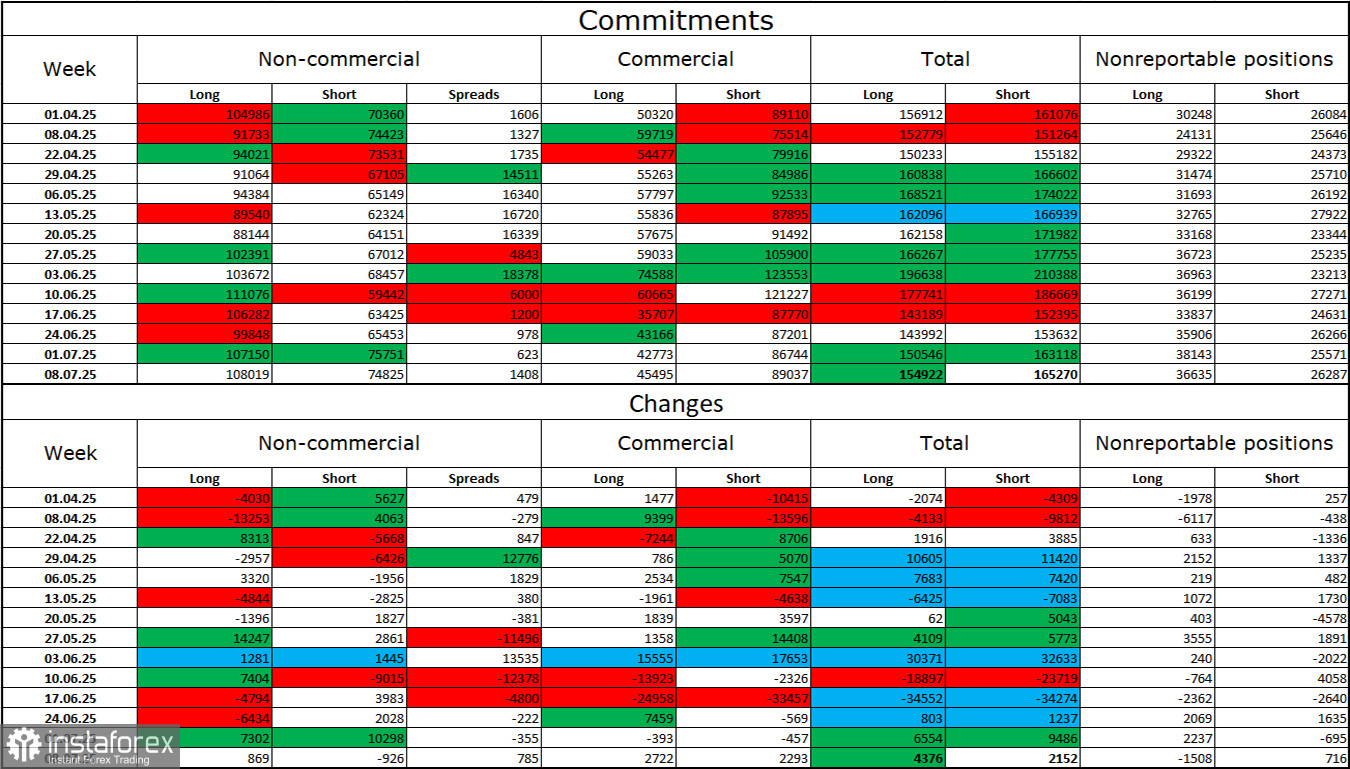
The sentiment among the "Non-commercial" category became slightly less bullish in the latest reporting week. The number of long positions held by speculators increased by 7,302, while the number of short positions rose by 10,298. However, bears have long lost their advantage and currently have no chance of success. The gap between the number of long and short positions stands at 32,000 in favor of the bulls: 107,000 versus 75,000.
In my opinion, the British pound still faces the prospect of further declines, but the events of 2025 have reshaped the market's long-term outlook. Over the past four months, the number of long positions has increased from 65,000 to 107,000, while short positions have decreased from 76,000 to 75,000. Under Donald Trump, confidence in the dollar has weakened, and COT reports show that traders have little interest in buying the U.S. dollar. Therefore, regardless of the general news backdrop, the dollar continues to fall due to events surrounding Trump.
News calendar for the U.S. and the U.K.:On Monday, the economic calendar contains no noteworthy entries. Thus, the news backdrop will not influence trader sentiment today.
GBP/USD Forecast and Trading Recommendations:
Selling opportunities were possible after a rebound from the 1.3611–1.3633 level with a target of 1.3527. That target has been met. New selling opportunities were available after a close below 1.3527 on the hourly chart, targeting 1.3444. This target is also nearly reached. Buy positions can be considered after a rebound from the 1.3444 level, with a target of 1.3527.
Fibonacci levels were drawn from 1.3446 to 1.3139 on the hourly chart and from 1.3431 to 1.2104 on the 4-hour chart.


