See also

 16.07.2025 04:22 AM
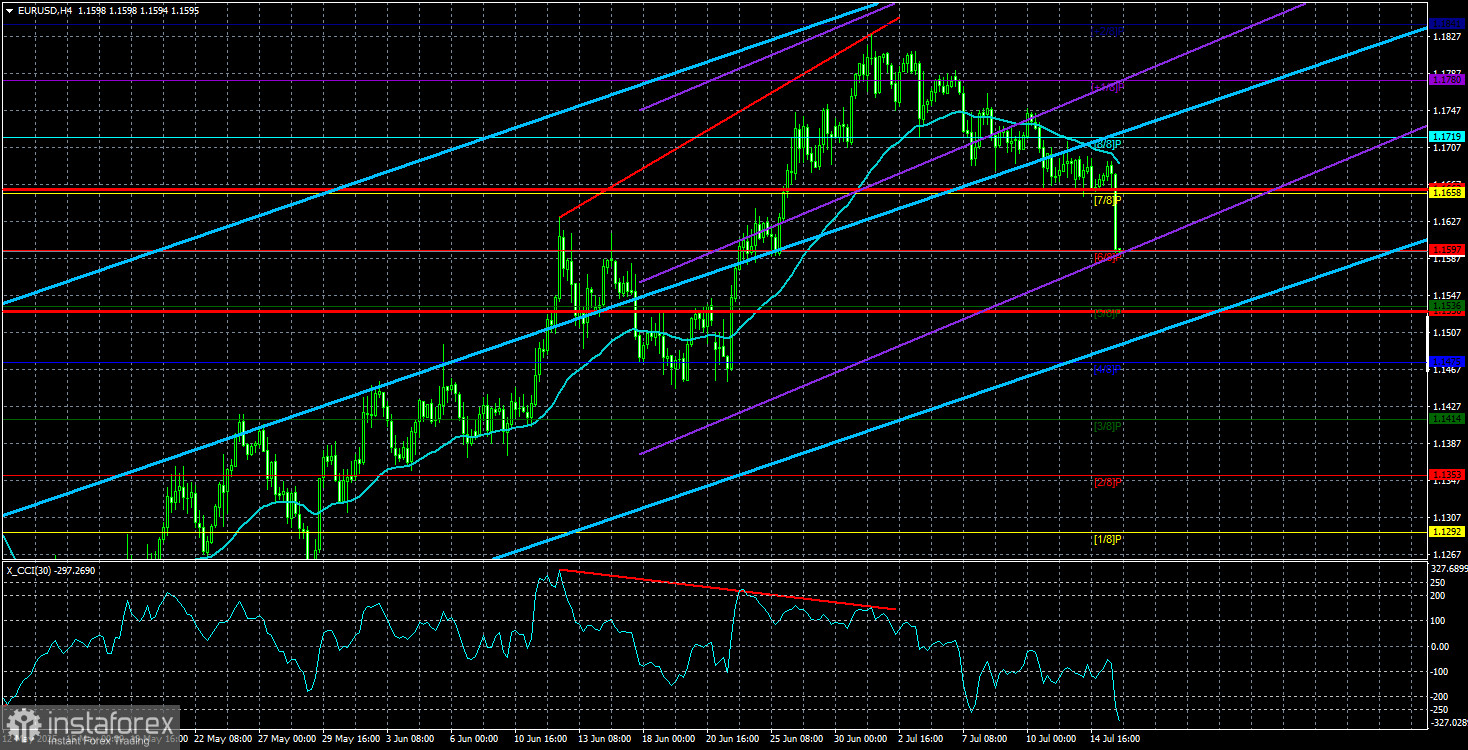
The EUR/USD currency pair continued to trade calmly throughout Tuesday. Of course, when the U.S. inflation report was released, there was an emotional spike in the market. However, overall, volatility in the pair is declining, and the dollar's rise over the past two weeks has been relatively weak. The chart below clearly shows that on three of the last five trading days, volatility hovered around 40 points. That is very, very low. Such volatility means there are practically no movements in the market.
Let's consider the most significant event this week, given the current circumstances. Despite Donald Trump's daily tariff increases over the past week and a half—both on trade partners and various goods and raw materials—the market has so far refrained from initiating a new wave of dollar sell-offs. We've repeatedly stated that what is underway is a purely technical correction, as there's no reason or foundation for the market to buy the dollar. Moreover, if tariffs are rising again and trade agreements are not being signed, then how can one even speak of any de-escalation in the trade war?
Thus, the most significant event this week was the release of U.S. inflation data. We won't go into the specific Consumer Price Index value. Suffice it to say that the figure is now essentially meaningless. Why? Inflation was the most significant indicator over the past two to three years. It directly influenced the level of the key interest rate—the main tool central banks use to steer the economy. If inflation rose or barely changed, the market expected tighter monetary policy from the central bank. If inflation dropped faster than expected, policy easing was anticipated.
However, that logical chain no longer holds. The European Central Bank has lowered its key rates to their minimum levels, and inflation has reached the target range. At this point, whether the CPI rises by a couple of tenths of a percent or falls doesn't matter—the ECB has achieved its goal. And even if inflation rises due to Trump's tariffs, it's unlikely we'll see any policy tightening in the EU in the near future. The ECB also has economists who have surely calculated the worst-case scenarios of how Trump's tariffs could impact the European economy.
The situation in the U.S. is slightly different. Inflation has been rising in recent months, albeit at a very slow pace. That's why Trump continues to pressure the Federal Reserve to cut rates—because inflation is not accelerating. But the Fed's monetary committee remains firm: inflation will rise, though no one knows by how much. Therefore, until that question is answered, talk of easing policy is off the table. As such, unless Donald Trump finalizes a global tariff policy for all countries and all industries, the Fed will remain inactive. That's why it doesn't matter if inflation rises or falls in any given month.
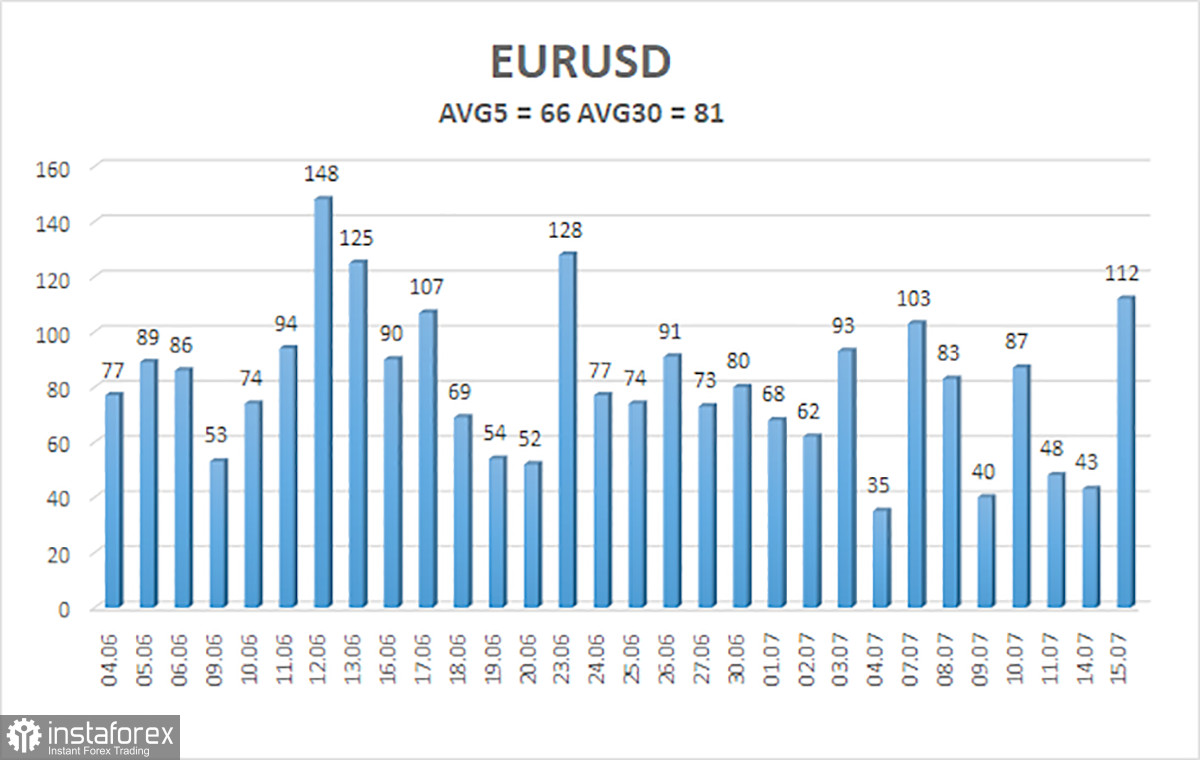
The average volatility of the EUR/USD currency pair over the last five trading days, as of July 16, is 66 pips, which is characterized as "moderate." We expect the pair to move between the levels of 1.1530 and 1.1662 on Wednesday. The long-term regression channel is pointing upward, still indicating a bullish trend. The CCI indicator has entered overbought territory and has formed several bearish divergences, which triggered a downward correction.
S1 – 1.1658
S2 – 1.1597
S3 – 1.1536
R1 – 1.1719
R2 – 1.1780
R3 – 1.1841
The EUR/USD pair remains in an uptrend but is currently in a correction phase. U.S. policy—both foreign and domestic—under Trump continues to exert a strong influence on the dollar. Although the dollar has been recovering in recent weeks, in our view, this does not yet justify medium-term buying. If the price remains below the moving average, small short positions may be considered with targets at 1.1536 and 1.1530, based purely on technical grounds. Above the moving average, long positions remain relevant, with targets at 1.1780 and 1.1841, continuing the trend.
Linear Regression Channels help determine the current trend. If both channels are aligned, it indicates a strong trend.
Moving Average Line (settings: 20,0, smoothed) defines the short-term trend and guides the trading direction.
Murray Levels act as target levels for movements and corrections.
Volatility Levels (red lines) represent the likely price range for the pair over the next 24 hours based on current volatility readings.
CCI Indicator: If it enters the oversold region (below -250) or overbought region (above +250), it signals an impending trend reversal in the opposite direction.


