See also

 16.07.2025 07:30 AM
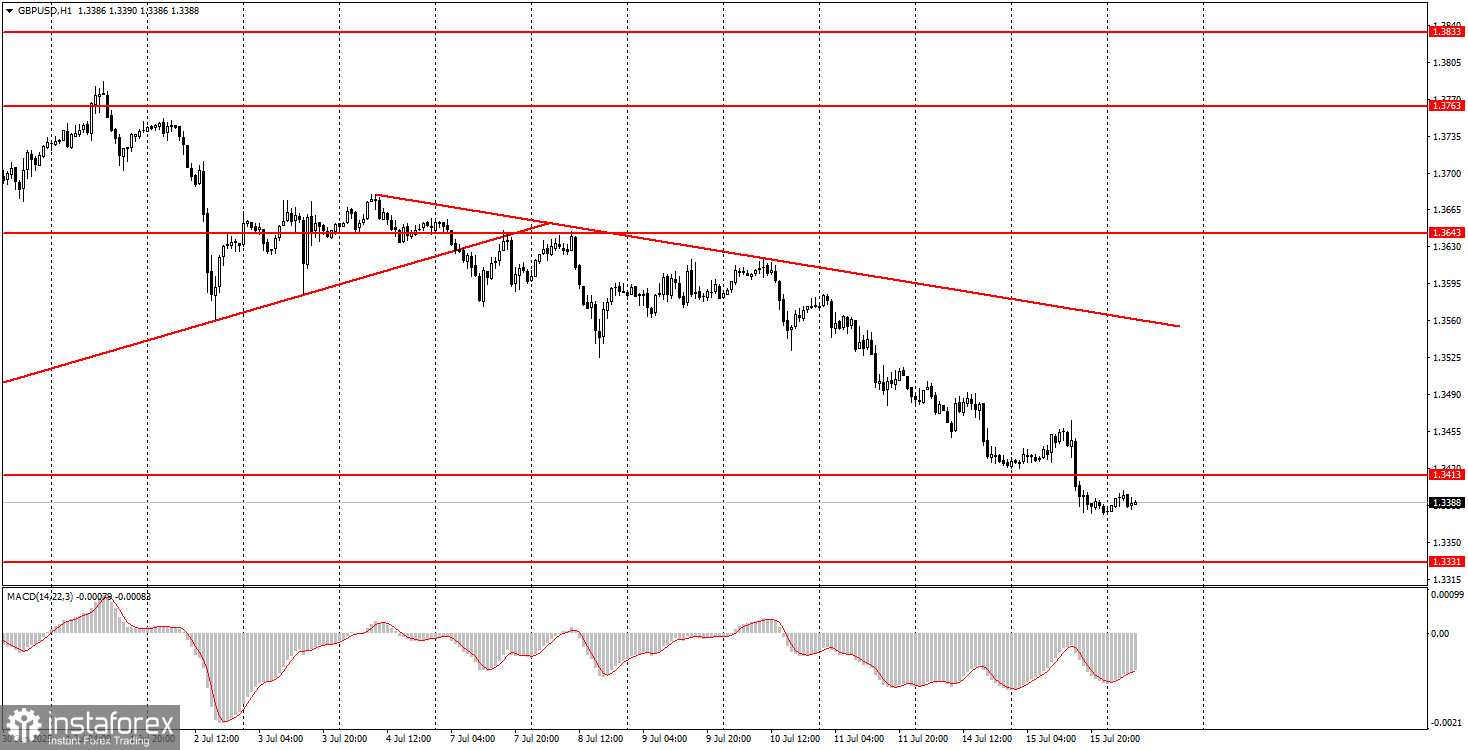
The GBP/USD pair also plummeted on Tuesday following the release of the U.S. inflation report. In recent weeks, the British pound has shown a steeper decline than the euro; however, both currency pairs remain in a broad technical correction, which is especially evident on higher timeframes. Thus, we are not inclined to believe that market sentiment has changed. We see no shifts in Donald Trump's policy, which has been dragging the dollar down for a full five months. If the U.S. currency is now rising by some miracle, it means only one thing — the market is saturated with dollar selling and is simply taking profit. In other words, traders are closing long positions on EUR/USD and GBP/USD, reducing demand for the euro and the pound, which leads to a rebound in the dollar.
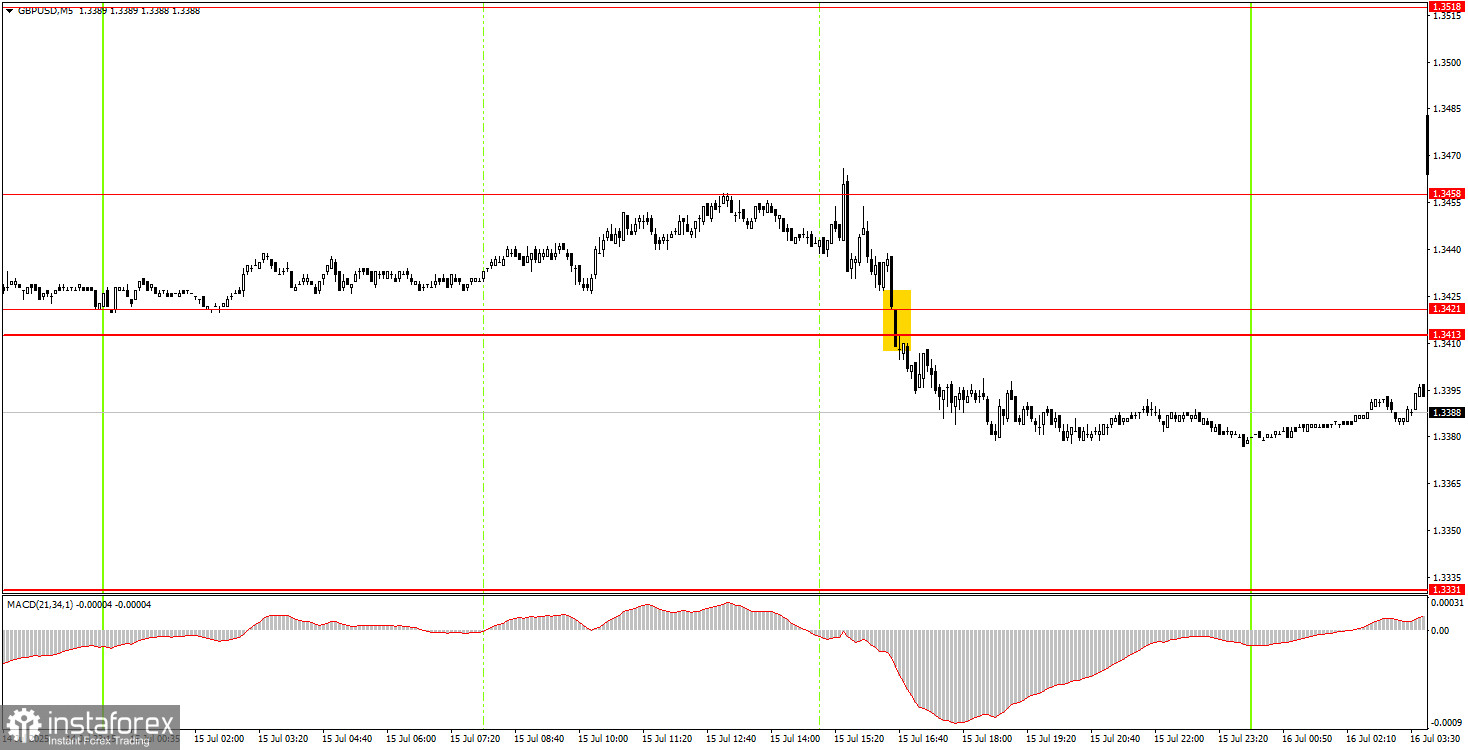
In the 5-minute time frame, only one sell signal formed on Tuesday. The 1.3458 level is a new level that was not part of prior analysis. During the U.S. session, the price consolidated below the 1.3413–1.3421 area, which allowed novice traders to open short positions. However, the decline didn't last long.
On the hourly chart, the GBP/USD pair continues to exhibit a strong downward movement. We believe the current decline is a purely technical correction, as there are no fundamental reasons for the dollar's rise. Nevertheless, the market can operate based on technical factors, which is precisely what we are observing now. Until the price consolidates above the trendline, there is no technical basis for resuming the six-month uptrend.
On Wednesday, the GBP/USD pair may continue to fall, but traders should consider the broader market sentiment and global fundamentals, which do not clearly support the U.S. dollar.
On the 5-minute time frame, current trading levels are: 1.3203–1.3211, 1.3259, 1.3329–1.3331, 1.3413–1.3421, 1.3458, 1.3518–1.3532, 1.3574–1.3590, 1.3643–1.3652, 1.3682, 1.3763, 1.3814–1.3832.
On Wednesday, UK inflation data will be released. While it's less important than U.S. inflation for the markets, a spike in volatility could still occur in the morning. As shown yesterday, the market's reaction to economic reports can be far from straightforward.
Support and Resistance Levels: These are target levels for opening or closing positions and can also serve as points for placing Take Profit orders.
Red Lines: Channels or trendlines indicating the current trend and the preferred direction for trading.
MACD Indicator (14,22,3): A histogram and signal line used as a supplementary source of trading signals.
Important Events and Reports: Found in the economic calendar, these can heavily influence price movements. Exercise caution or exit the market during their release to avoid sharp reversals.
Forex trading beginners should remember that not every trade will be profitable. Developing a clear strategy and practicing proper money management are essential for long-term trading success.


