See also

 22.07.2025 10:12 AM
Trend Analysis (Fig. 1)
On Tuesday, the market may continue moving upward from the 1.1692 level (closing of the previous daily candle), targeting 1.1739 – the 23.6% pullback level (yellow dashed line). Upon testing this level, the price may retrace downward to test the upper fractal at 1.1721 (daily candle from July 16, 2025).
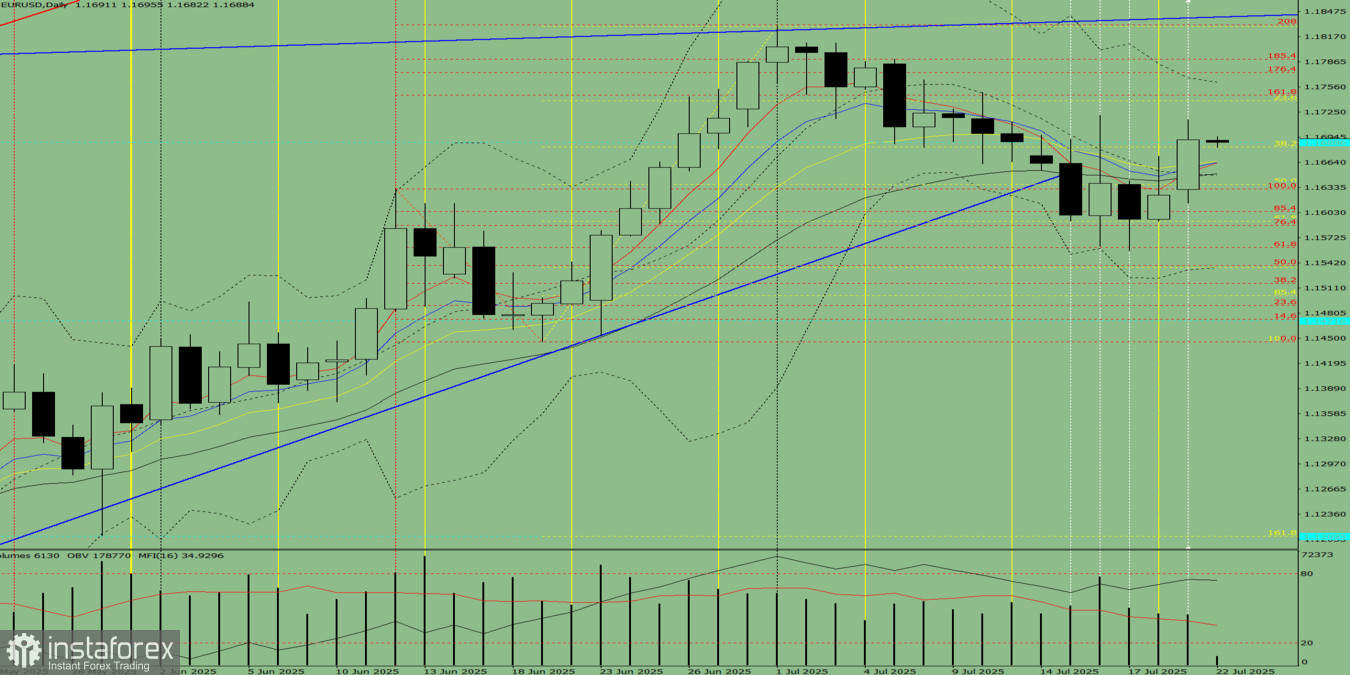
Fig. 1 (Daily Chart)
Composite Analysis:
General Conclusion: Upward trend
Alternative Scenario:
From the 1.1692 level (closing of the previous daily candle), the price may continue to rise toward the 1.1739 pullback level (yellow dashed line). Upon testing this level, the price may further continue upward to test the target level at 176.4% – 1.1773 (red dashed line).
You have already liked this post today
*The market analysis posted here is meant to increase your awareness, but not to give instructions to make a trade.


