See also

 23.07.2025 10:57 AM
On Tuesday, the EUR/USD pair rebounded from the 127.2% Fibonacci retracement level at 1.1712, but the upward movement continued after a close above that level. As a result, the bulls may continue pushing the price toward the next retracement level at 1.1802. A consolidation below 1.1712 would support the U.S. dollar and suggest a potential decline toward 1.1645.
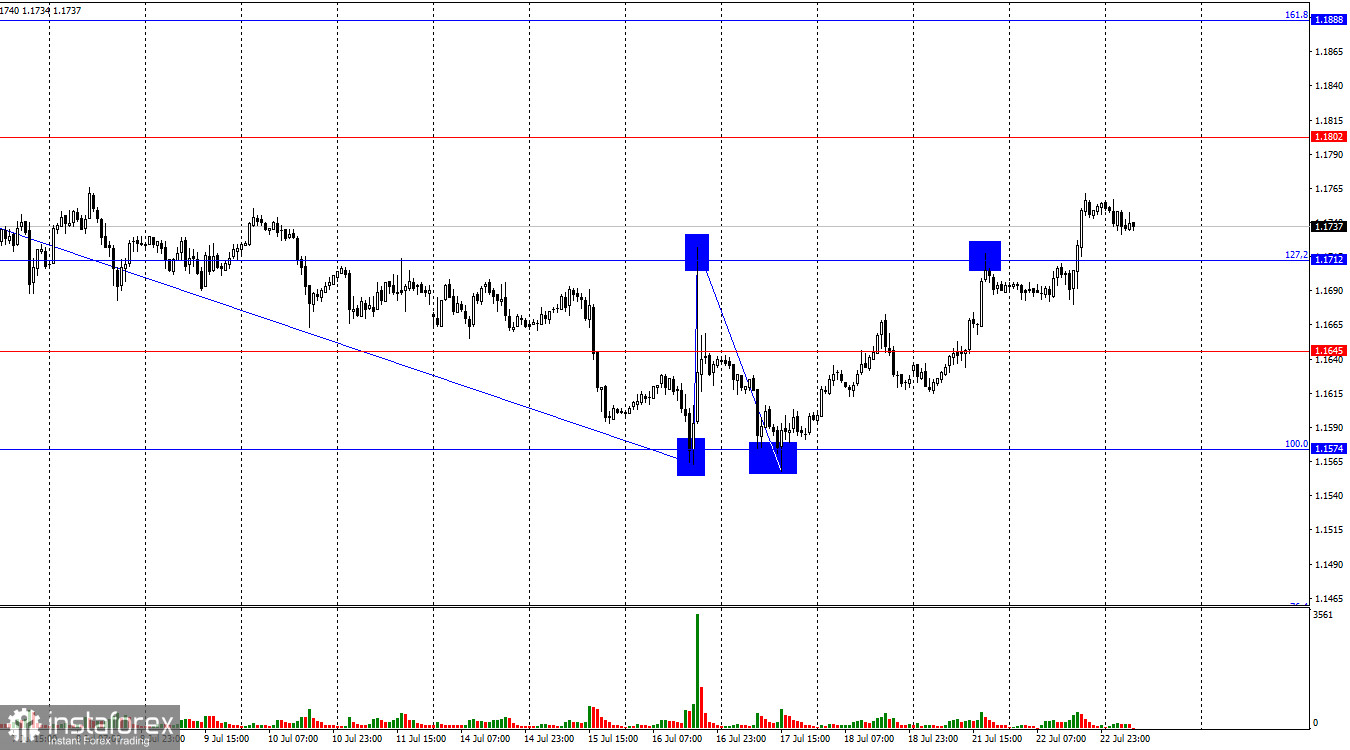
The wave pattern on the hourly chart remains simple and clear. The last completed downward wave did not break the low of the previous one, while the most recent upward wave broke the previous high. This confirms a continued bullish trend, despite a prolonged correction. The lack of real progress in U.S. trade negotiations, the low probability of reaching agreements with most countries, and the prospect of further tariff increases continue to create negative conditions for the bears.
On Tuesday, there were virtually no notable developments, but over the past few days, several reports emerged indicating that trade talks between the European Union and the United States are reaching an impasse. Donald Trump proposed raising tariffs on imports from the EU to 30%, followed by negotiations on a trade deal. This proposal was met with confusion in the EU, where officials increasingly note that negotiations with Washington are extremely difficult due to the constantly shifting terms. The EU is seriously considering a package of countermeasures in case an agreement with Trump cannot be reached. Trump himself believes talks can continue after August 1, but starting on that date, the EU would have to pay tariffs to export to the U.S. In my view, the talks are headed toward failure rather than a successful deal. This continues to put pressure on the U.S. dollar.
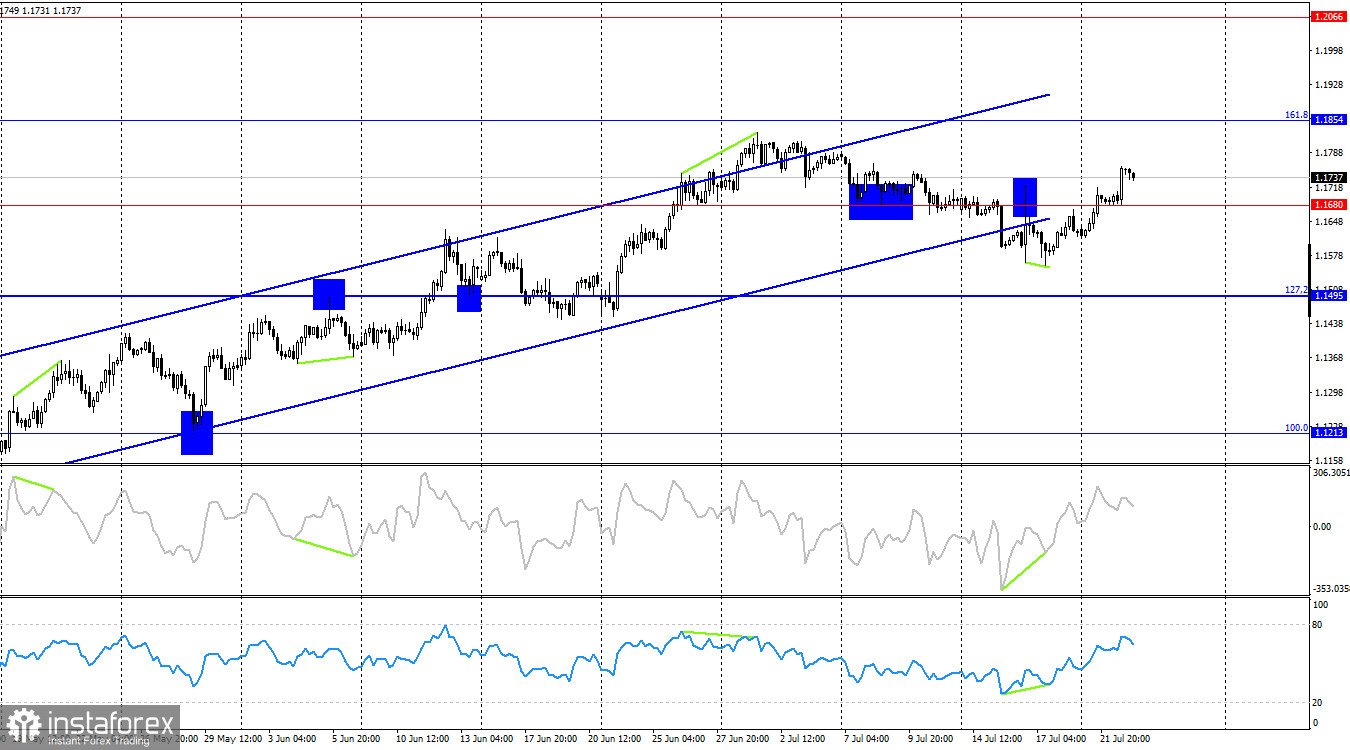
On the 4-hour chart, the pair reversed in favor of the euro and consolidated above the 1.1680 level. Earlier, the euro had closed below the ascending trend channel. I am still hesitant to declare the start of a bearish trend. At the moment, the hourly chart appears more informative. The pair exited the channel not due to bearish strength, but due to the duration of the correction. The upward movement may continue toward the 161.8% Fibonacci level at 1.1854.
Commitments of Traders (COT) Report:
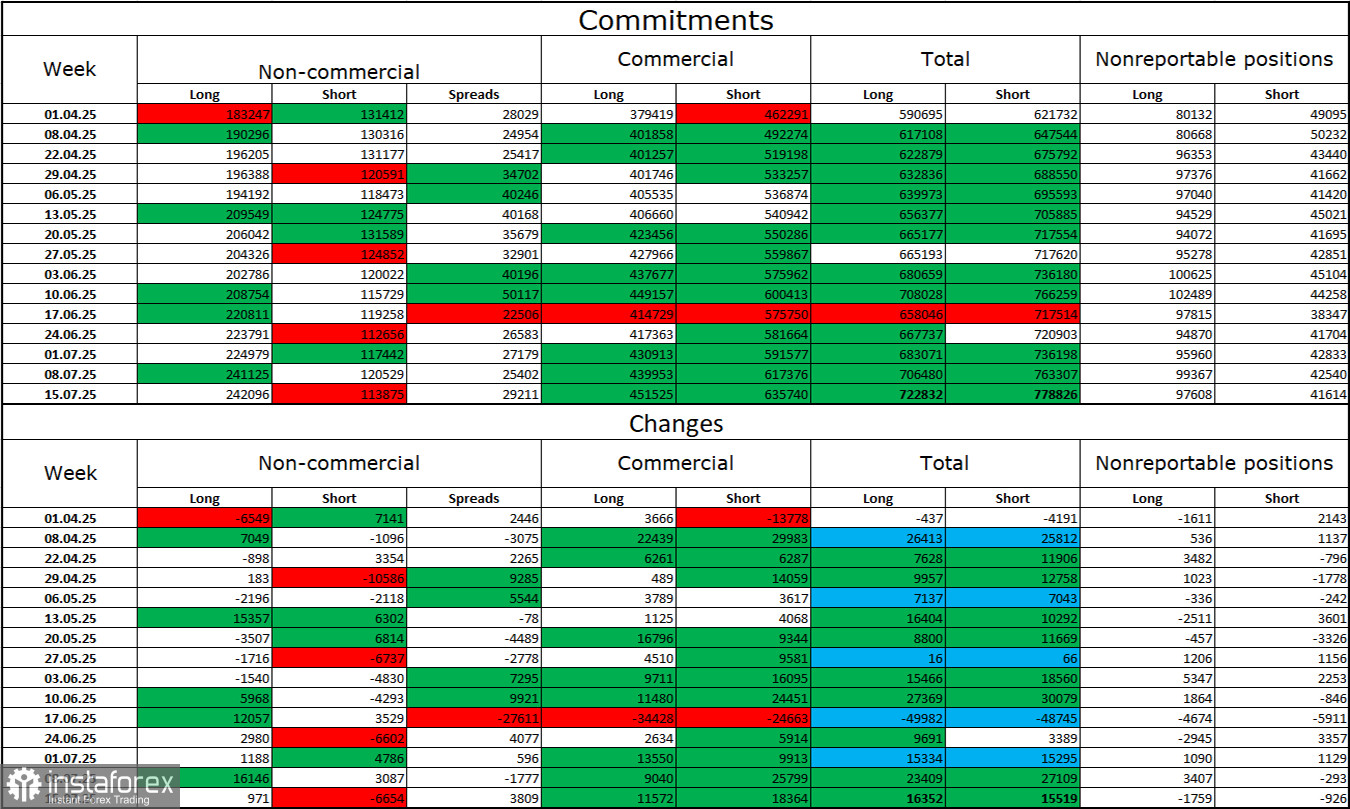
In the latest reporting week, professional traders opened 971 long positions and closed 6,654 short positions. The sentiment among the "Non-commercial" group remains bullish, largely due to Donald Trump, and is steadily strengthening. The total number of long positions held by speculators now stands at 242,000, while short positions amount to 113,000—a more than twofold difference. Also, note the number of green cells in the table above—they reflect strong accumulation of euro positions. In most cases, interest in the euro is increasing, while interest in the dollar is declining.
For 23 consecutive weeks, major players have been reducing short positions and increasing long positions. While there is still a significant difference in monetary policy between the ECB and the Fed, Donald Trump's policies remain a more influential factor for traders, as they may lead to a U.S. economic recession and a host of long-term structural problems for the country.
News Calendar for the U.S. and the Eurozone:
The July 23 economic calendar contains no important releases. As a result, the news background is expected to have little to no impact on market sentiment on Wednesday.
EUR/USD Forecast and Trader Recommendations:
I do not recommend selling the pair today, as the bulls have clearly regained momentum. Buy positions were possible on a rebound from 1.1574 on the hourly chart, with a target of 1.1645. Additional buy opportunities appeared after a close above 1.1645 with a target of 1.1712—both targets have been met. Yesterday, new positions could be opened after a close above 1.1712 with a target of 1.1802. Today, holding existing long positions remains a valid strategy.
Fibonacci levels are drawn from 1.1574 to 1.1066 on the hourly chart and from 1.1214 to 1.0179 on the 4-hour chart.


