See also

 24.07.2025 09:05 AM
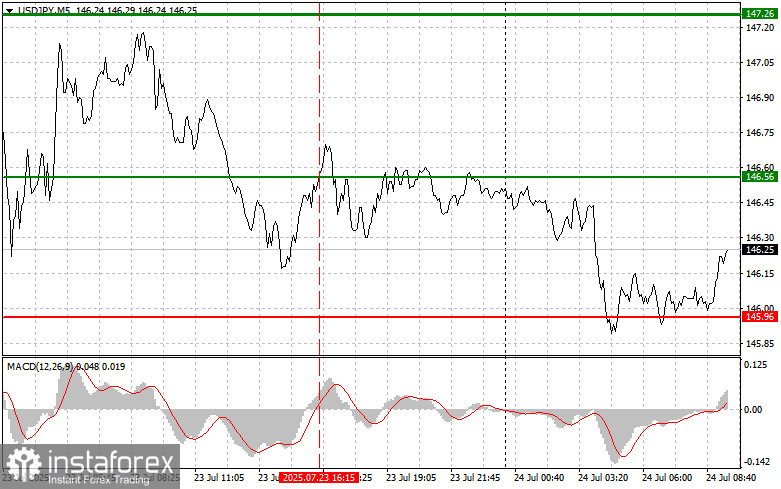
The test of the 146.56 level occurred when the MACD indicator had already moved significantly above the zero line, which limited the pair's upward potential—especially in the context of the prevailing bearish market.
Traders continued to buy the yen yesterday, supported by the trade agreement between the U.S. and Japan, as well as weak U.S. housing market data. Fresh economic reports from the U.S., particularly those showing a slowdown in housing activity, put additional pressure on the dollar. Investors, concerned about the outlook for the American economy, sought safer assets, resulting in increased demand for the yen. The U.S.–Japan trade agreement, which has come into effect, also played a role. It involves tariff reductions and easing of trade barriers, potentially benefiting Japanese exporters and strengthening the yen's position. The yen's appreciation against the dollar reflects a broader trend of shifting away from risk assets.
Today's mixed data on Japan's business activity indices—decline in manufacturing PMI and growth in services PMI—were largely ignored by traders. This market reaction highlights the complex relationship between macroeconomic indicators and investor sentiment. While a deterioration in the manufacturing sector would typically weigh on the yen, and growth in the services sector would support it, these effects were offset in this case. It's possible that traders viewed the changes as insignificant or were focused on more impactful developments. The market's disregard for the PMI data may also suggest that expectations about Japan's economy were already priced in.
For intraday strategy, I will focus primarily on Scenarios #1 and #2.
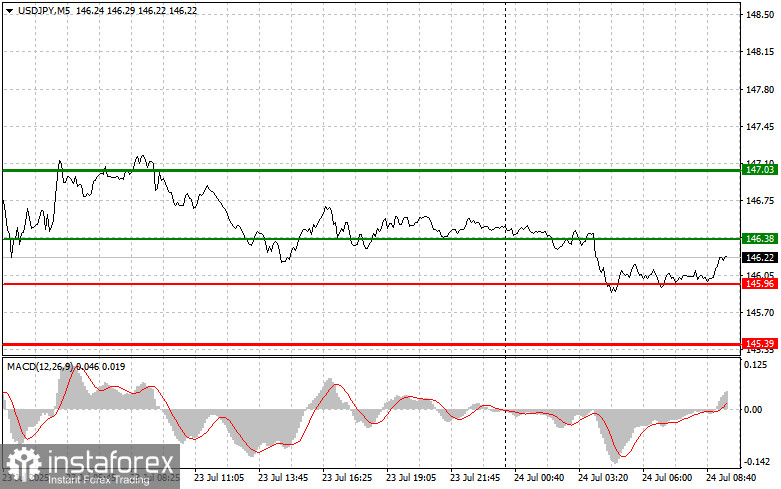
Scenario #1: I plan to buy USD/JPY today around the 146.38 level (indicated by the green line on the chart), targeting a rise to 147.03 (represented by the thicker green line). Around 147.03, I plan to exit long positions and open short positions in the opposite direction (expecting a 30–35 point retracement from the level). It's best to buy the pair during corrections and deeper pullbacks in USD/JPY.
Important: Before buying, ensure the MACD indicator is above the zero line and is just starting to rise from it.
Scenario #2: I also plan to buy USD/JPY if there are two consecutive tests of the 145.96 level while the MACD is in oversold territory. This will limit the pair's downside potential and lead to a market reversal upward. A rise toward the opposite levels of 146.38 and 147.03 can be expected.
Scenario #1: I plan to sell USD/JPY only after the pair breaks below the 145.96 level (red line on the chart), which should trigger a quick decline. The key target for sellers will be 145.39, where I intend to exit short positions and open long positions in the opposite direction (expecting a 20–25 point rebound from the level). Downward pressure on the pair could return at any moment today.
Important: Before selling, ensure the MACD indicator is below the zero line and is just starting to decline from it.
Scenario #2: I also plan to sell USD/JPY if there are two consecutive tests of the 146.38 level while the MACD is in the overbought zone. This would limit the pair's upside potential and lead to a downward market reversal. A decline toward the opposite levels of 145.96 and 145.39 can be expected.