See also

 28.07.2025 10:58 AM
On Friday, the EUR/USD pair returned to the 127.2% retracement level at 1.1712 and rebounded from it. This suggests that the upward movement may continue toward the next level at 1.1802. A firm move below 1.1712 would favor the U.S. dollar and signal a potential decline toward 1.1645.
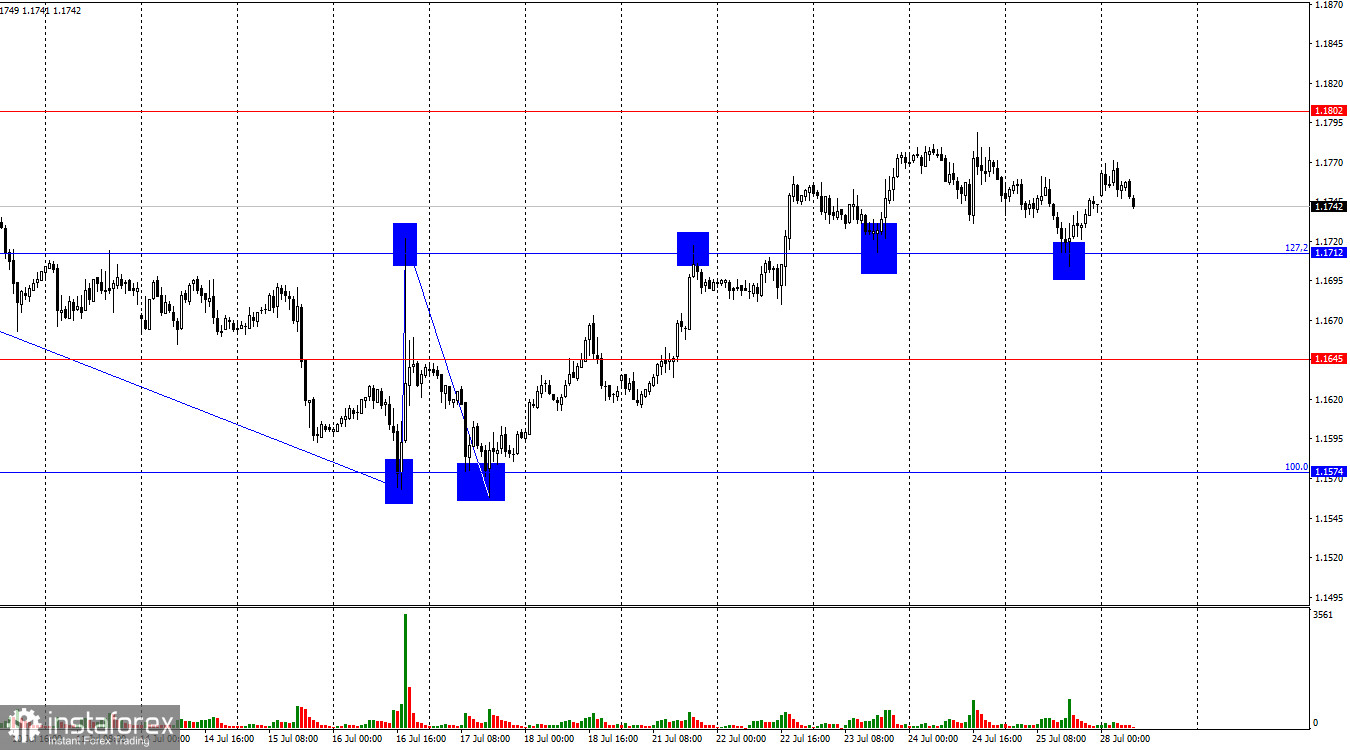
The wave structure on the hourly chart remains simple and clear. The last completed downward wave did not break the low of the previous wave, while the last upward wave broke above the previous high. This indicates that the trend remains bullish, despite the prolonged correction. Donald Trump has managed to sign several favorable deals, which could strengthen the position of the bears in the near future. However, it is worth noting that most of the U.S.'s trading partners have yet to reach agreements with Washington.
There were few noteworthy events on Friday, but on Sunday, Donald Trump and Ursula von der Leyen announced that the U.S. and EU had reached a trade agreement. Recall that August 1 was the deadline for negotiations set by Trump. After that date, tariffs on European imports were scheduled to rise to 30–50%. Fortunately, that outcome was avoided. Under the agreement, mutual tariffs of 15% will be imposed, while the EU has committed to investing around 600 billion dollars in the U.S. economy, increasing energy purchases to 750 billion dollars, and buying military equipment. The deal is clearly beneficial for the United States. But will it support the bears and the dollar? It must be acknowledged that global trade tensions are starting to ease. Just a few weeks ago, agreements with China and the EU seemed unlikely, but now all sides appear committed to negotiations rather than confrontation. Therefore, the broader decline in the dollar may be nearing its end.
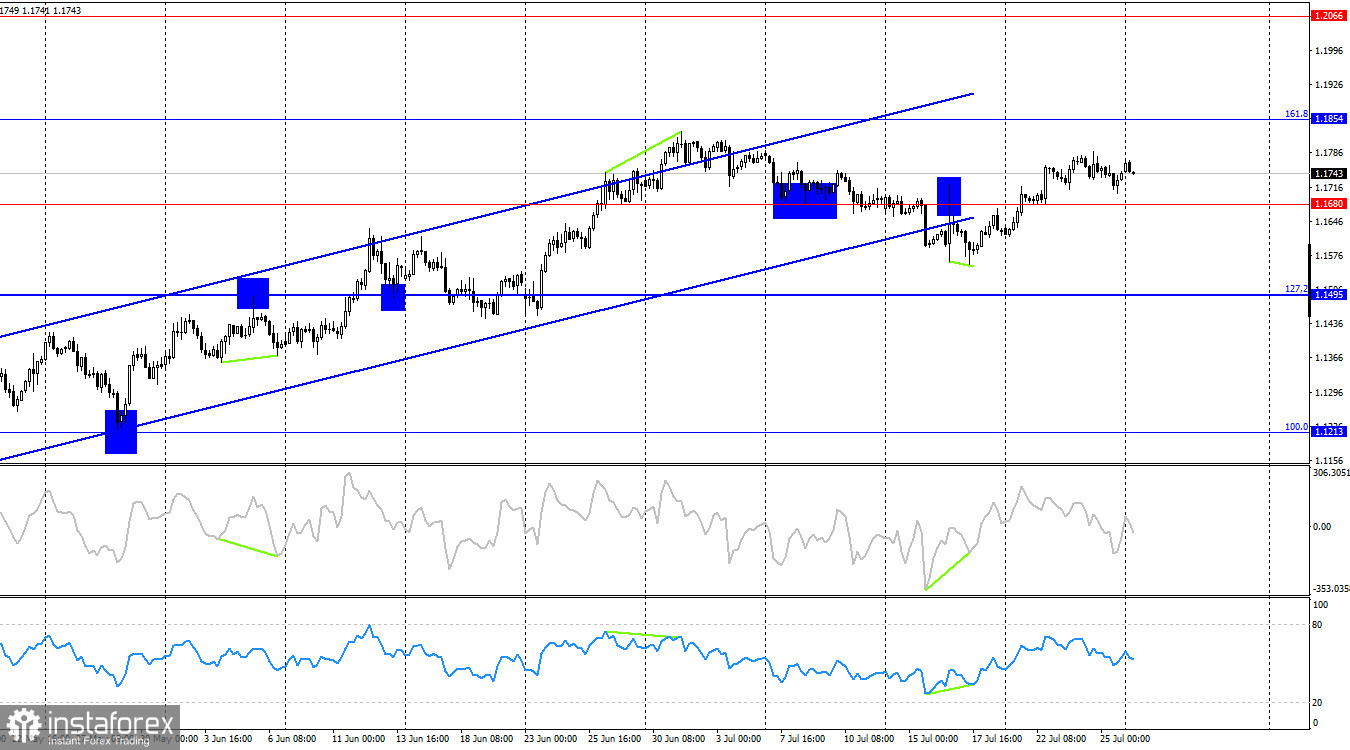
On the 4-hour chart, the pair has reversed in favor of the euro and consolidated above the 1.1680 level. Previously, the euro had closed below the ascending trend channel. I still refrain from concluding that a bearish trend has begun. In my opinion, the hourly chart is currently more informative. The pair exited the channel not because of bearish strength, but due to the length of the correction. The upward movement may continue toward the 161.8% Fibonacci level at 1.1854.
Commitments of Traders (COT) Report:
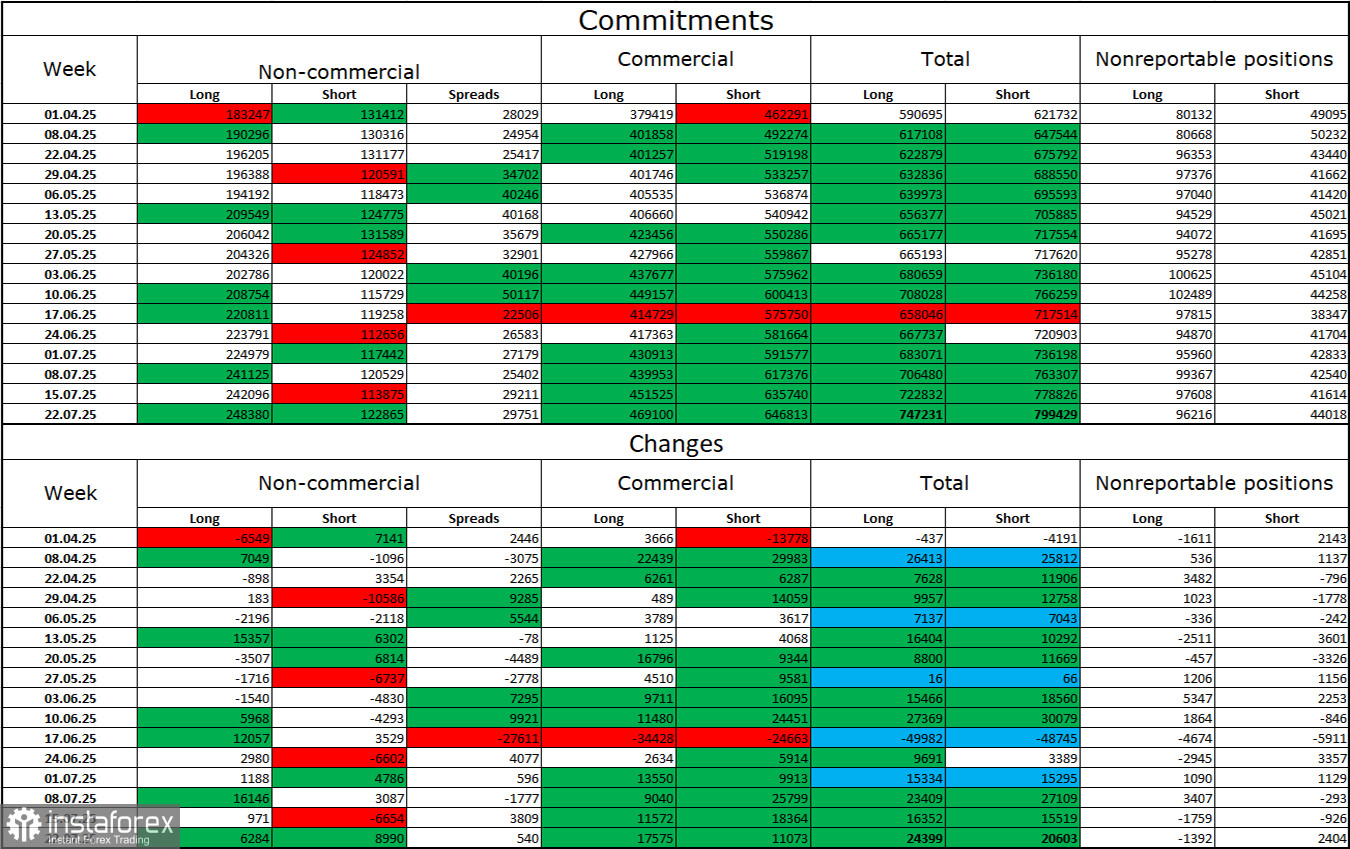
During the last reporting week, professional traders opened 6,284 long positions and 8,990 short positions. Sentiment in the "Non-commercial" group remains bullish and continues to strengthen, largely due to Donald Trump's actions. The total number of long positions held by speculators now stands at 248,000, compared to 122,000 short positions—a more than twofold difference. Also note the number of green cells in the upper table, which reflect significant increases in positions on the euro. In most cases, interest in the euro continues to grow, while interest in the dollar is declining.
For twenty-four consecutive weeks, large market participants have been reducing short positions and increasing long positions. Trump's policy remains the most significant factor for traders, as it could lead to a recession in the U.S. economy and other long-term structural challenges. Despite the recent signing of several key trade agreements, I still see no change in the overall sentiment of major players.
Economic Calendar for the U.S. and the EU:
On July 28, the economic calendar contains no scheduled events. Therefore, market sentiment on Monday is unlikely to be affected by news flow.
EUR/USD Forecast and Trader Recommendations:
Selling the pair is possible today on a rebound from the 1.1802 level on the hourly chart, targeting 1.1712; or on a firm move below 1.1712, targeting 1.1645. Buying opportunities were available earlier on a rebound from 1.1574, a close above 1.1645, or a close above 1.1712 with a target of 1.1802. For now, it is still possible to hold open long positions with targets at 1.1802 and 1.1888 until a sell signal forms. I recommend moving your Stop Loss closer to current price levels.
Fibonacci grids are drawn from 1.1574 to 1.1066 on the hourly chart and from 1.1214 to 1.0179 on the 4-hour chart.


