See also

 30.07.2025 05:13 AM
Oil (CL)
By this morning, the price has reached the target level of 69.43 and the MACD line on the weekly scale.
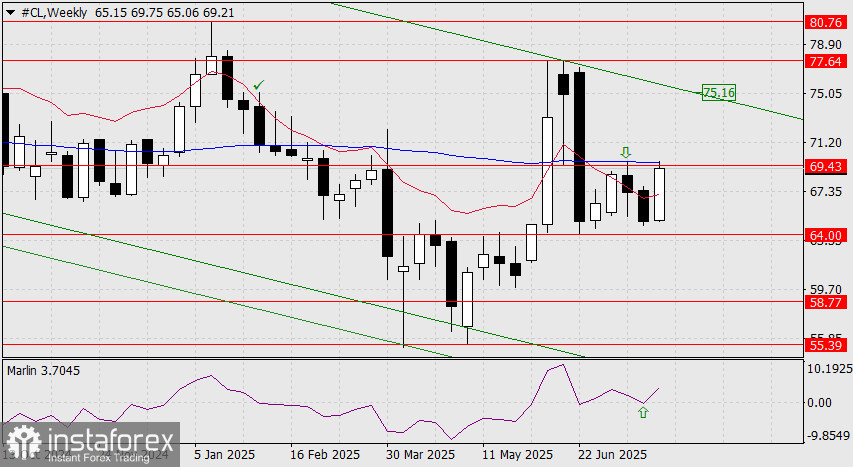
Two weeks ago, a pullback lasting two weeks occurred from these resistance levels (see arrow), but the current situation is slightly different — the signal line of the Marlin oscillator has turned upward from the zero line, indicating the likely direction of movement. If the price breaks above the resistance, it may move toward the target at the upper boundary of the price channel around 75.16.
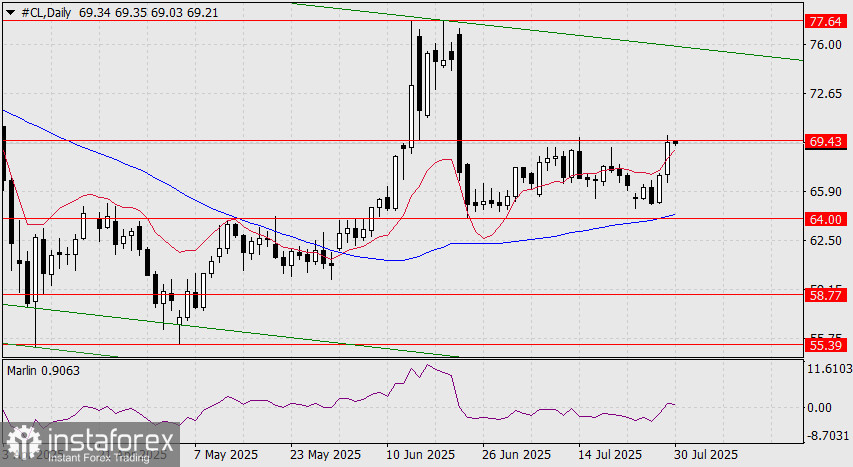
On the daily chart, the Marlin oscillator has entered the positive territory. And just in time, as the price is hesitating around the 69.43 level. However, the price has risen above the balance line (red moving average), which is also a growth stimulus.
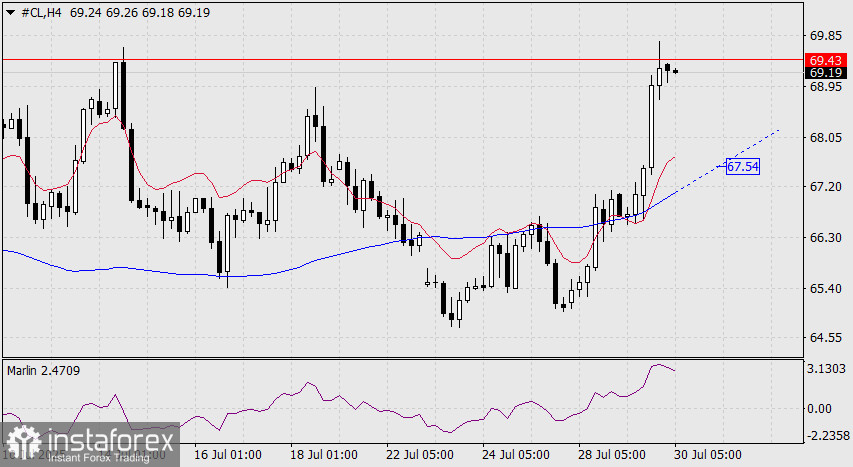
On the four-hour chart, the situation is more complicated — here, the Marlin oscillator is correcting downward. If the price aligns with this sentiment, it could decline toward the MACD line at 67.54. A false move is possible due to the FOMC meeting.
You have already liked this post today
*The market analysis posted here is meant to increase your awareness, but not to give instructions to make a trade.


