See also

 31.07.2025 01:09 PM
Trend Analysis (Fig. 1):
On Thursday, from the level of 1.1404 (Wednesday's daily candle close), the market may start moving upward toward the 14.6% retracement level at 1.1456 (yellow dotted line). Upon testing this level, the price may pull back downward toward the 161.8% target level at 1.1413 (red dotted line).
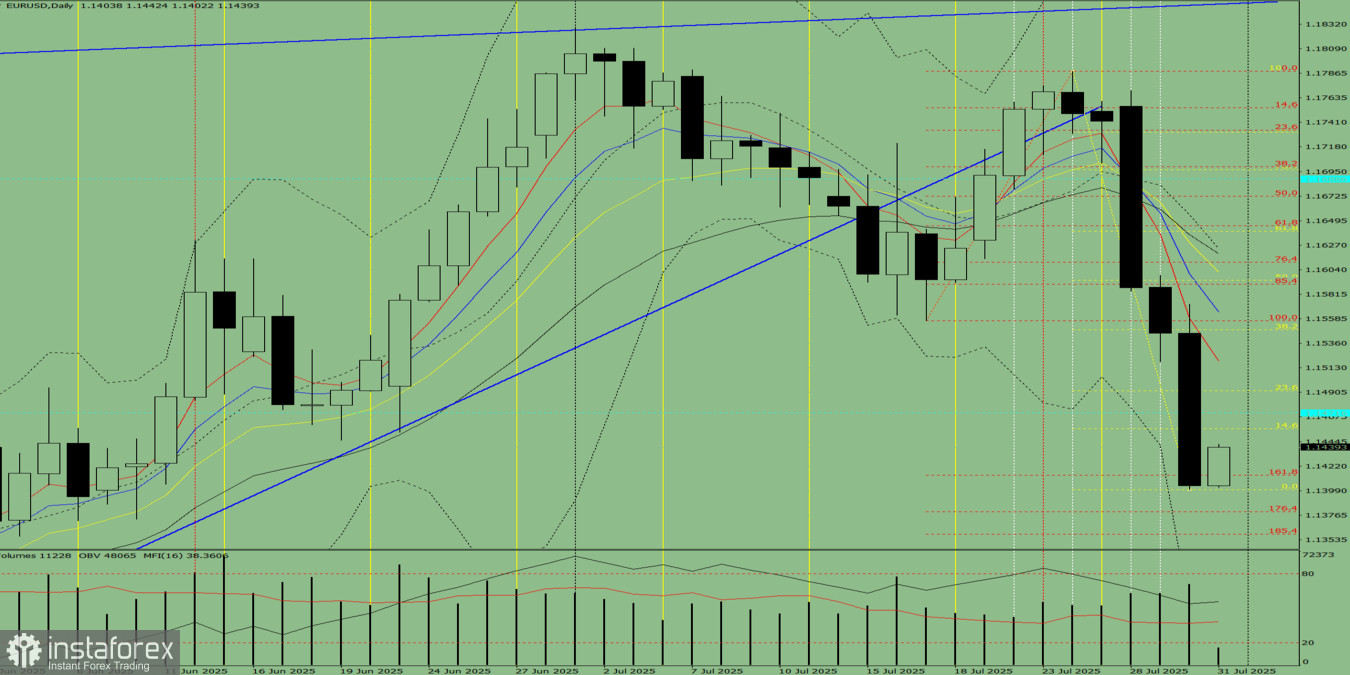
Fig. 1 (Daily Chart)
Composite Analysis:
Overall Conclusion: Upward trend.
Alternative Scenario: On Thursday, from the level of 1.1404 (Wednesday's daily candle close), the market may start moving upward toward the historical resistance level of 1.1472 (blue dotted line). Upon testing this level, the price may continue downward toward 1.1400 – the lower fractal (yellow dotted line).
You have already liked this post today
*The market analysis posted here is meant to increase your awareness, but not to give instructions to make a trade.


