See also

 31.07.2025 11:33 AM
Bitcoin briefly dipped following the Fed's recent decision but quickly rebounded, maintaining its range-bound trade between $116,000 and $120,000. This sideways movement may soon lay the groundwork for a breakout to new all-time highs.

Yesterday marked a significant milestone: the United States released its first official report on cryptocurrency policy. One of the most striking highlights was the decision to retain confiscated bitcoins on the US Treasury's balance sheet. This move underscores the growing legitimacy of BTC as a valuable asset and may set a global precedent.
Equally notable is the government's ban on issuing a Federal Reserve digital dollar (CBDC). This reflects concerns over potential disruptions to the banking system and privacy risks. It also demonstrates a firm commitment to supporting existing financial institutions over government-run digital alternatives.
The report outlines pro-crypto measures aimed at fostering industry growth. Banks are now expected to serve crypto businesses without regulatory harassment or unjustified pressure. This development is likely to reduce uncertainty and improve the environment for digital asset innovation.
Another major positive shift is the Justice Department's intention to abandon intimidation tactics through lawsuits. Instead, the focus will shift to establishing a clear and fair regulatory framework, signaling a willingness to work alongside the industry rather than against it.
Finally, the report places strong emphasis on dollar-backed stablecoins. The US administration considers them crucial to maintaining the dollar's dominance in the digital age and is committed to supporting their development.
Trading outlook:
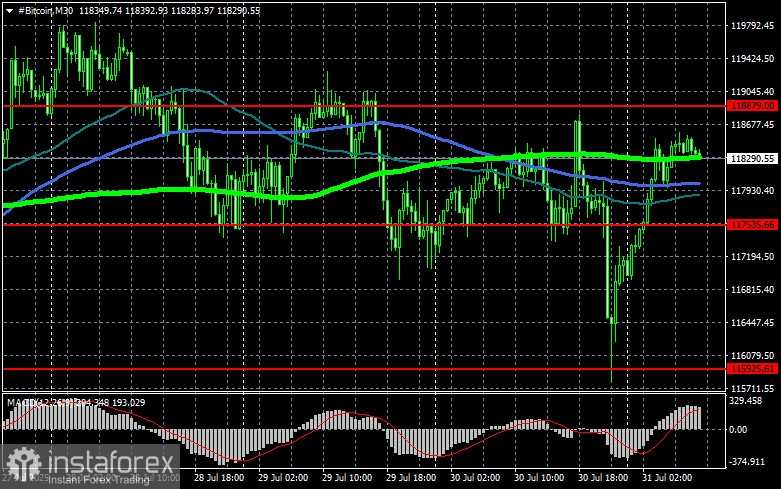
Buyers of BTC are currently targeting a return to the $118,800 level, which would open the way to $120,400 and potentially to the $122,000 resistance. The ultimate bullish target lies near $123,900. If BTC falls, support is expected at $117,500; dropping below this level could quickly send the price down to $115,900, and potentially toward $114,000.
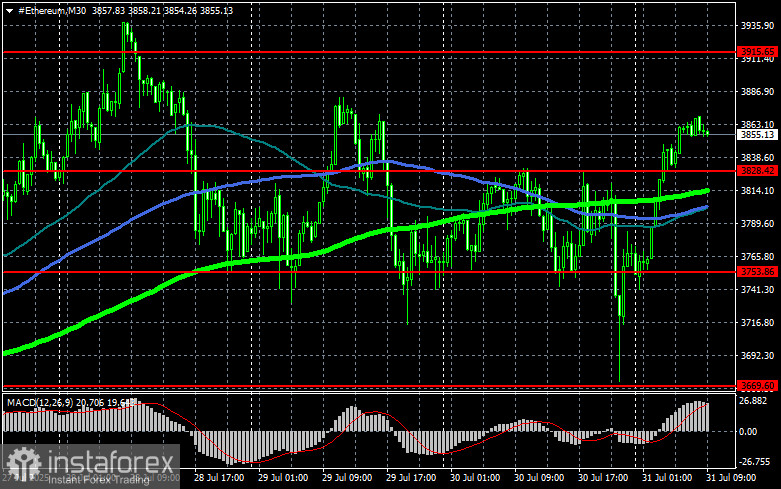
As for Ethereum, a firm hold above $3,915 could pave the way to $4,002, with a further rise to $4,101 indicating renewed bullish momentum. On the downside, $3,828 serves as a critical support; a break below it could drive ETH down to $3,753 or even $3,669.
What we see on the chart:
Red lines indicate key support and resistance levels, expected to act as reversal or breakout points.Green lines indicate 50-day moving averageBlue lines indicate 100-day moving averageLight green lines indicate 200-day moving averageCrossing or testing these moving averages often initiates a new market impulse or halts ongoing trends.


