See also

 01.08.2025 04:42 AM
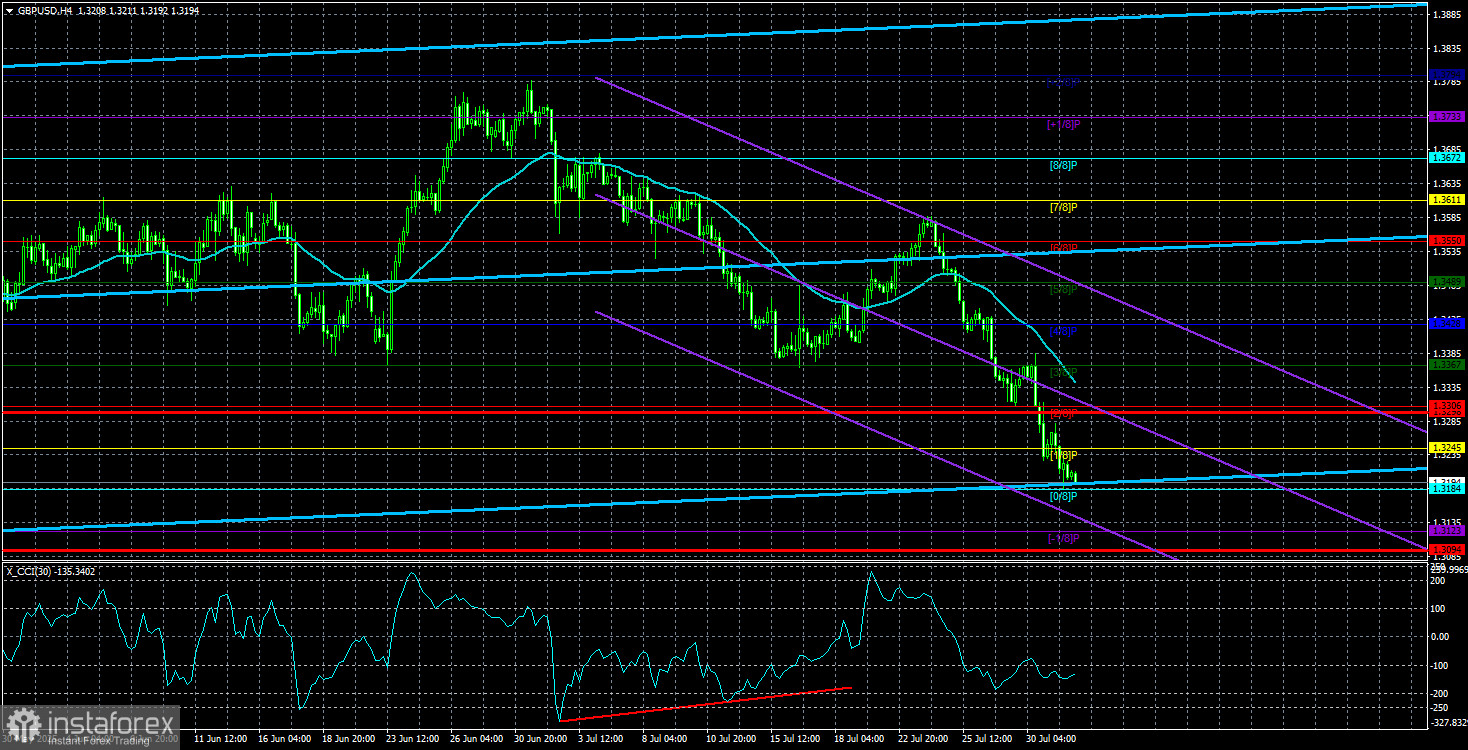
This week, the GBP/USD currency pair has focused on just one thing: declining. The drop in the British pound began last week, and at the time, we concluded that this movement had technical grounds, as there were simply no other reasons. This week, however, the U.S. dollar is rising in full alignment with macroeconomic and fundamental conditions. This raises the question — how far can the dollar go from here?
At first glance, it all seems straightforward. If Donald Trump was right, and the U.S. economy is now set to grow at ultra-fast rates while all major trading partners funnel hundreds of billions of dollars into the U.S. budget, then logically, the dollar should return to the levels from which it began its decline in January 2025. But should we expect that outcome?
We believe it's still far too early to speak of such a scenario. This is a global movement, so it's best to examine higher timeframes to understand the prospects. At the moment, the GBP/USD pair has approached the Senkou Span B line on the 24-hour timeframe, which increases the likelihood that the current downward correction may be coming to an end. Furthermore, U.S. labor market and unemployment data are scheduled to be released today, which could easily trigger a decline in the dollar. However, if the price confidently breaks through the Ichimoku cloud, strong technical grounds would emerge for expecting not only a local rise in the dollar but the beginning of a new downward trend.
In our view, the market has spent the last six months selling the dollar not due to the trade war itself or concerns about an economic slowdown resulting from it. Of course, those factors have played a role, but we believe the key reason lies in Trump's policies. The U.S. president is indeed celebrating one victory after another — countries are willing to pay tariffs to access the U.S. market, invest hundreds of billions of dollars into the U.S. economy, and buy raw materials and energy resources from the U.S. in massive volumes. But at the same time, who in the world is truly happy about this?
Today, all countries realize that a deal with Trump today doesn't eliminate the possibility of a new trade war tomorrow. As a result, the world is gradually moving away from relying on the currency of a country governed by someone who believes he can impose rules on everyone.
Let me remind you that Trump's latest initiative is to impose massive tariffs on all countries that buy energy resources and weapons from Russia, unless Moscow reaches a ceasefire with Ukraine within the next 10 days. Thus, Trump might see himself as a global peacemaker, but many nations clearly resent being told what to do. Trump certainly holds many cards, as most of the world trades with the U.S. in some way. However, recent years have already shown us that when negotiations fail, war can begin. And no one is looking for another war.
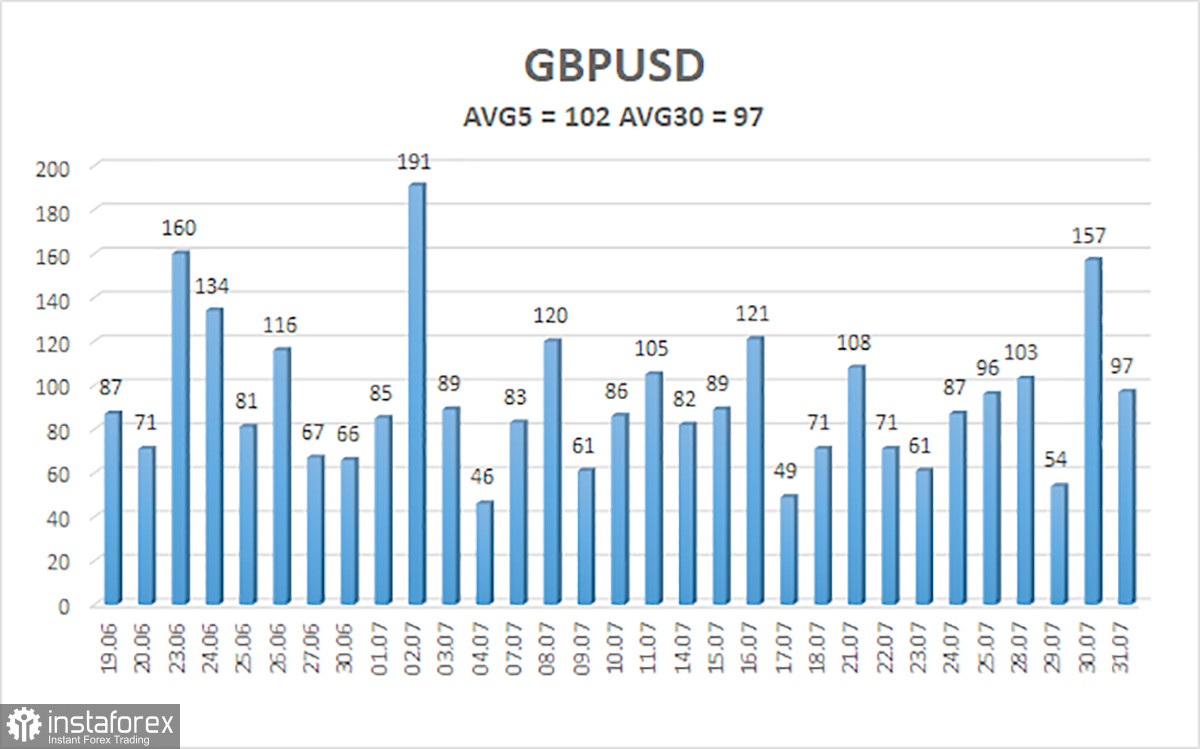
The average volatility of the GBP/USD pair over the last five trading days is 102 pips, which is considered "average" for this pair. On Friday, August 1, we expect the pair to move within a range bounded by levels 1.3094 and 1.3296. The long-term linear regression channel is pointing upward, which still indicates a clear uptrend. The CCI indicator has entered oversold territory twice, signaling the possible resumption of the upward trend. A new phase of corrective movement is currently underway.
S1 – 1.3184
S2 – 1.3123
S3 – 1.3062
R1 – 1.3245
R2 – 1.3306
R3 – 1.3367
The GBP/USD pair has resumed its downward correction. However, in the medium term, Trump's policies are likely to continue exerting pressure on the dollar. Thus, long positions with targets at 1.3550 and 1.3611 remain relevant as long as the price stays above the moving average. If the price falls below the moving average line, short positions with targets at 1.3123 and 1.3094 may be considered on purely technical grounds. From time to time, the dollar shows corrective strength, but for a trend-based rally to develop, it would need real signs of the end of the global trade war — something that now seems increasingly unlikely.
Linear Regression Channels help determine the current trend. If both channels are aligned, it indicates a strong trend.
Moving Average Line (settings: 20,0, smoothed) defines the short-term trend and guides the trading direction.
Murray Levels act as target levels for movements and corrections.
Volatility Levels (red lines) represent the likely price range for the pair over the next 24 hours based on current volatility readings.
CCI Indicator: If it enters the oversold region (below -250) or overbought region (above +250), it signals an impending trend reversal in the opposite direction.


