See also

 01.08.2025 04:52 AM
Yesterday, markets saw a broad retreat from risk assets: the S&P 500 declined by 0.37%, the U.S. Dollar Index rose by 0.16%, and oil fell by 0.90%. Yields on government bonds remain within Monday's range, currently balanced by risk aversion and expectations of persistently high rates. More telling, however, is the 8.01% jump in the S&P 500 VIX "fear index" (to 16.72) — the largest daily increase since the third decade of May, when Moody's downgraded the U.S. credit rating.
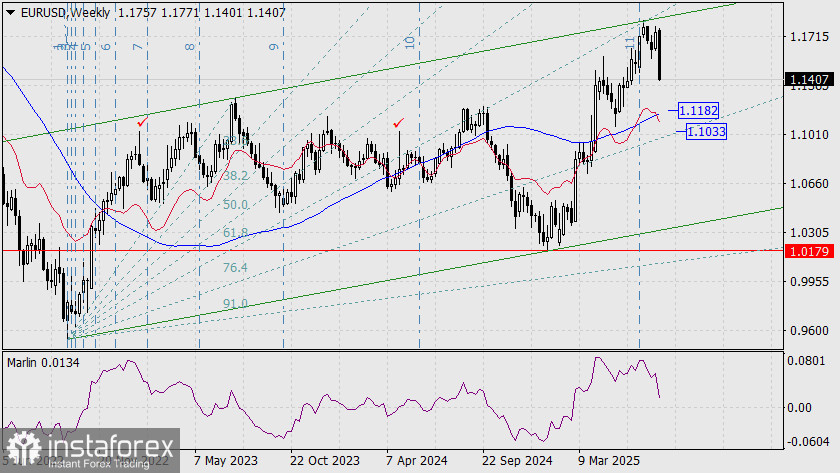
On the weekly chart, the price is declining toward two key targets:
– 1.1182 at the MACD line,
– 1.1033 at the Fibonacci ray.
Notably, the latter target aligns with the April 2024 and January 2023 highs (marked with ticks).
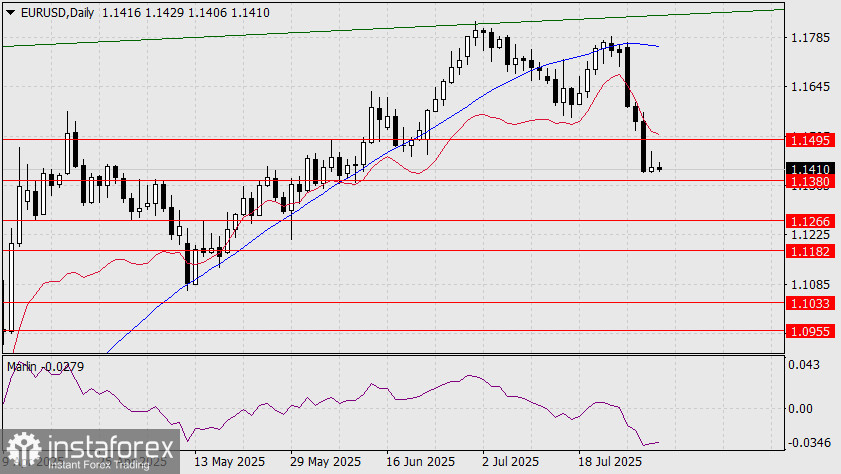
On the daily chart, the price is poised to break below the 1.1380 support level, targeting the next support at 1.1266. Today's U.S. employment data for June is expected to be moderately positive — the Nonfarm Payrolls forecast stands at 106,000. The ISM Manufacturing PMI for July is projected to rise from 49.0 to 49.5.
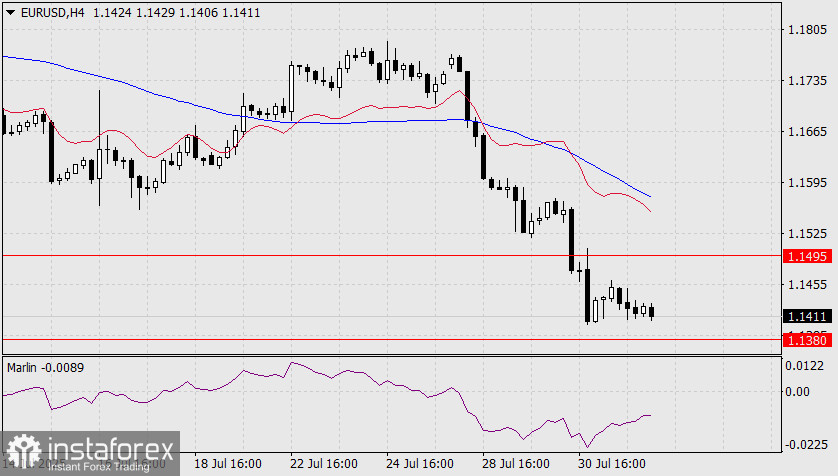
On the H4 chart, during the recent price consolidation, the Marlin oscillator managed to edge higher, creating room for a further decline.
You have already liked this post today
*The market analysis posted here is meant to increase your awareness, but not to give instructions to make a trade.


