See also

 01.08.2025 07:09 AM
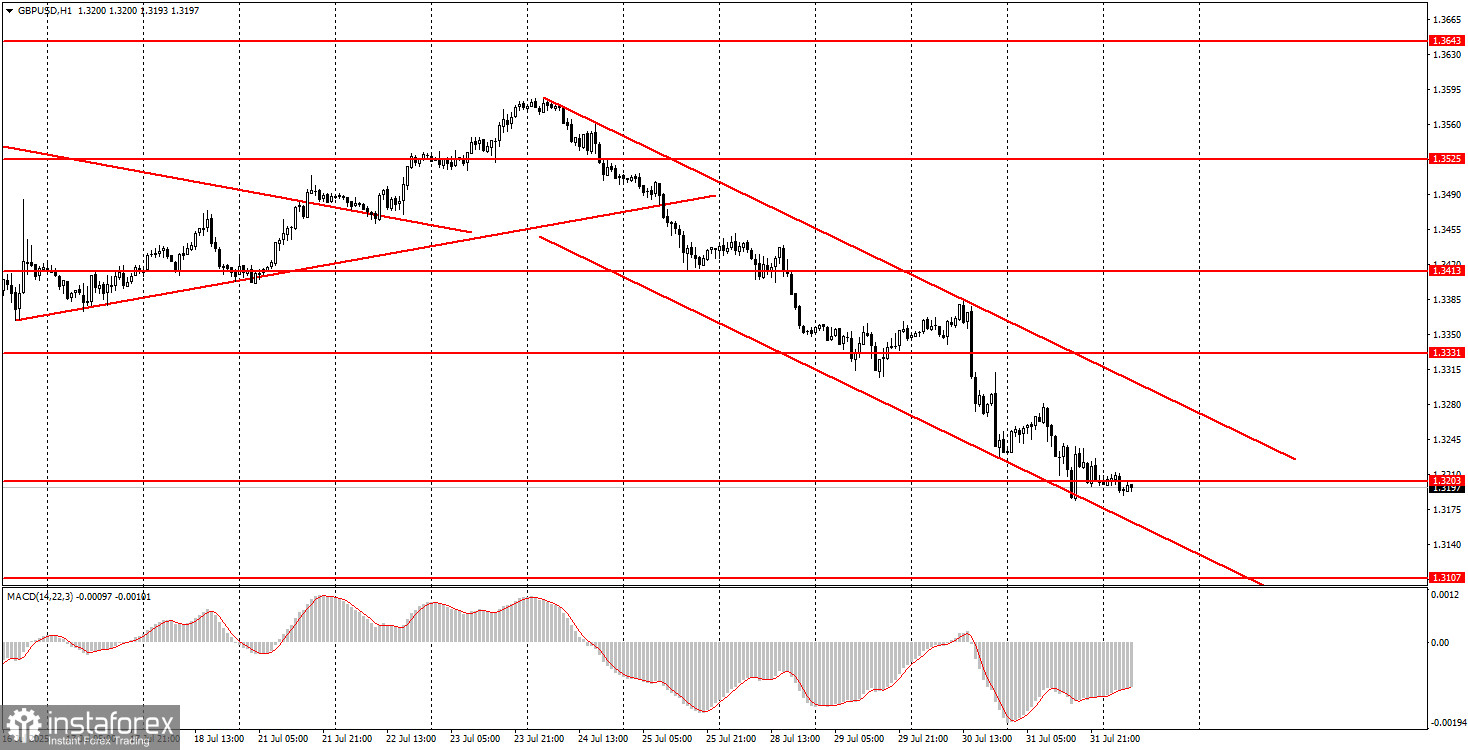
On Thursday, the GBP/USD pair ignored the complete lack of new reasons to decline and continued moving downward by inertia. Recently, the British pound has been underwhelming. Last week, two out of five trading days ended in failure for the pound, and this week, sterling has been unable to avoid declines even on days without any negative news. It seems that the pound has grown excessively over the past six months, and the market is now actively correcting that situation.
From a technical standpoint, a nearly perfect descending channel has formed, providing reference points for traders. Therefore, one should not expect the end of the downtrend on the hourly timeframe—which is part of a relatively mild correction on the daily chart—until the price consolidates above this channel. We still believe there are no strong reasons for a long-term rise in the U.S. dollar. This week has favored the American currency, but the stream of positive data and news won't last forever.
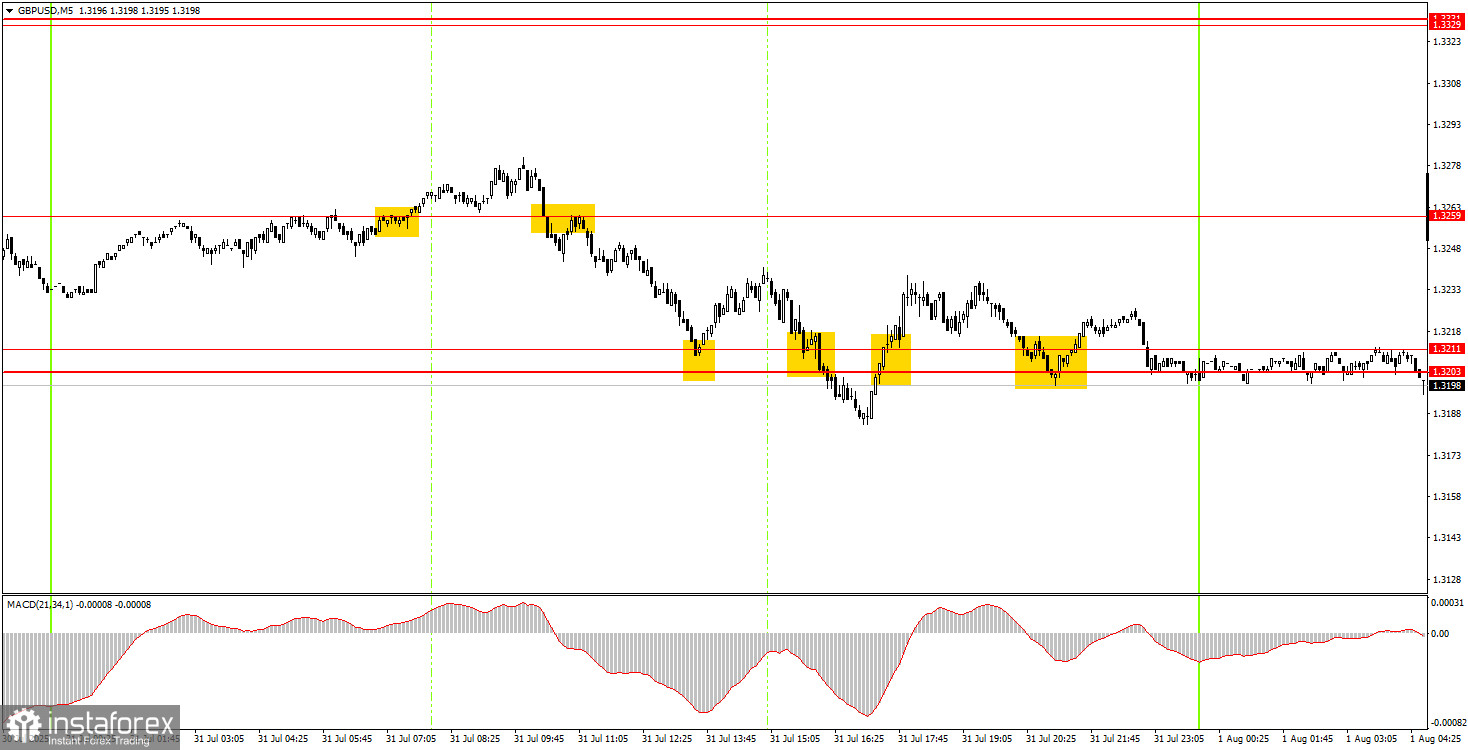
In the 5-minute timeframe, Thursday produced a multitude of trading signals. Around the 1.3259 level, two signals formed, one of which turned out to be false. Near the 1.3203–1.3211 range, four signals were generated, and all of them were false. Thus, it was a difficult trading day for novice traders, and turning a profit was even harder. However, there's a silver lining: the pound is currently experiencing a decline driven by enthusiasm and momentum.
In the hourly timeframe, the GBP/USD pair continues to show signs of a downward technical correction. The British pound has been falling for six consecutive days, though it would be more accurate to say that the dollar has been rising for six straight days. Last week, the reasons for the decline were purely technical, while this week, nearly every news item has worked in favor of the U.S. currency.
On Friday, the GBP/USD pair might slightly bounce upward from the 1.3203 level, but the macroeconomic backdrop will be far more important than technical analysis today. We may see another round of volatility during the U.S. trading session.
On the 5-minute timeframe, the current trading levels are: 1.3102–1.3107, 1.3203–1.3211, 1.3259, 1.3329–1.3331, 1.3413–1.3421, 1.3466, 1.3518–1.3532, 1.3574–1.3590, 1.3643–1.3652, 1.3682, 1.3763.
No significant events or reports are scheduled in the UK for Friday, while in the U.S., three of the most important reports will be released: NonFarm Payrolls, unemployment rate, and the ISM Manufacturing PMI.
Support and Resistance Levels: These are target levels for opening or closing positions and can also serve as points for placing Take Profit orders.
Red Lines: Channels or trendlines indicating the current trend and the preferred direction for trading.
MACD Indicator (14,22,3): A histogram and signal line used as a supplementary source of trading signals.
Important Events and Reports: Found in the economic calendar, these can heavily influence price movements. Exercise caution or exit the market during their release to avoid sharp reversals.
Forex trading beginners should remember that not every trade will be profitable. Developing a clear strategy and practicing proper money management are essential for long-term trading success.


