See also

 11.08.2025 05:01 AM
The euro has settled even more firmly at the 1.1632 support level. The longer it consolidates there, the more balanced the probabilities of growth and decline will become. However, two factors are influencing this neutral structure and subtly increasing the chances for the bears: Fibonacci time line No. 8, which gets closer with each candlestick, and the Marlin oscillator, which, amid sideways price movement, will remain in negative territory.
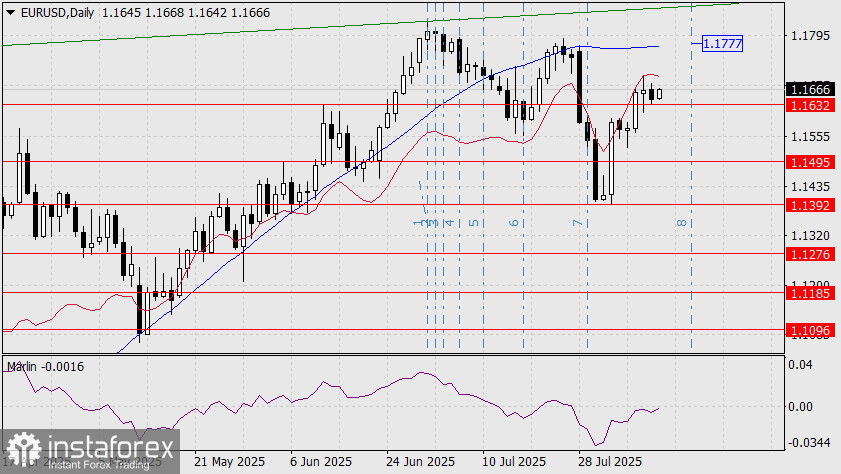
In this situation, either on August 15 or August 18, the euro could break down toward the nearest target at 1.1495 and then further to 1.1392.
For an upward move to develop, the price must break above the August 7 high at 1.1699 (with the target at 1.1777 — the MACD line), while for a downward move, it must firmly consolidate below 1.1632.
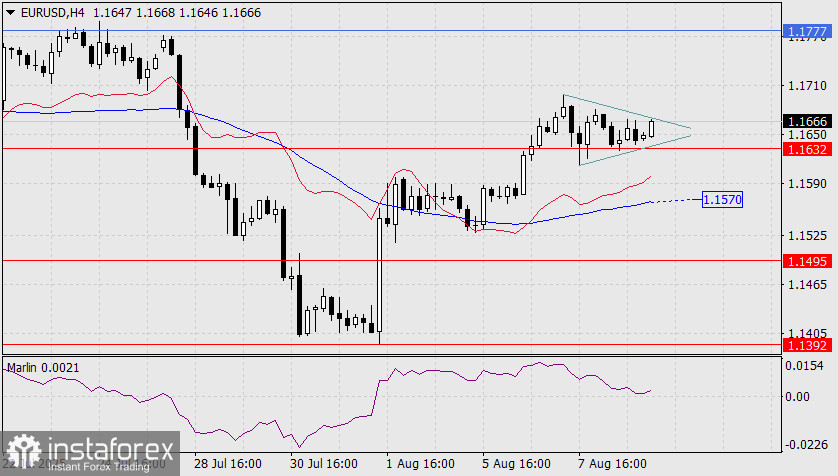
On the four-hour chart, the price has formed a triangle — a trend continuation pattern — but ongoing consolidation could easily turn it into a typical range. The Marlin oscillator's signal line has approached the zero line, and in the event of sideways price movement, it is likely (especially as it moved down from above) to remain in a sideways channel below it, in the negative zone. The first downside target is 1.1570 — the MACD line.
You have already liked this post today
*The market analysis posted here is meant to increase your awareness, but not to give instructions to make a trade.


