See also

 12.08.2025 03:32 AM
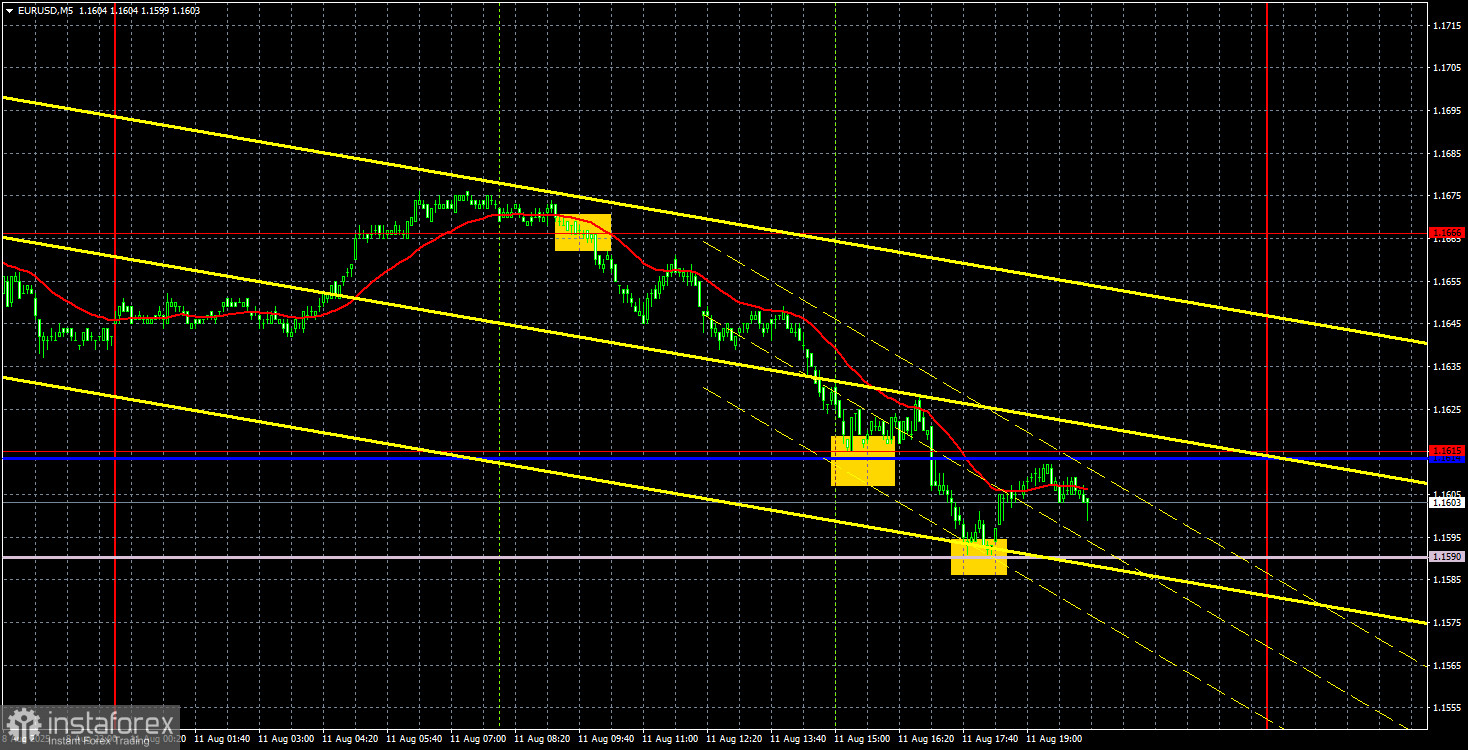
On Monday, the EUR/USD currency pair showed a downward movement but generally traded within roughly the same range as in recent days. The euro had been rising for a week and a half, so a minor correction is not out of place. Yesterday, there was no macroeconomic background, and not even any news from the White House. The market continues to prepare for today's US inflation report (which, in essence, carries no real significance but may still trigger a strong market reaction) and for Friday's meeting between US and Russian leaders in Alaska (which could mark the beginning of the end of the conflict in Ukraine). Thus, it is unlikely that this week will be boring.
We still do not see any reason for the dollar to show medium-term growth. On both the hourly and daily timeframes, we are talking at most about a correction. At the moment, a break below the Senkou Span B line would change the trend to a downward one, but first, the price must confidently overcome this line. If a rebound occurs, the upward trend will remain in place, and the euro's growth will continue.
On the 5-minute timeframe yesterday, two trading signals were formed. Early in the European session, the price consolidated below the 1.1666 level, and by the start of the US session, it reached the 1.1615 level and the Kijun-sen line. Here, short positions could be closed with profit. The rebound from the 1.1615 level was very weak, and the price then moved down to the Senkou Span B line. Thus, the second buy signal turned out to be false. Overall, Monday's volatility was not high. A rebound from the Senkou Span B line can be traded in combination with consolidation above the critical line.
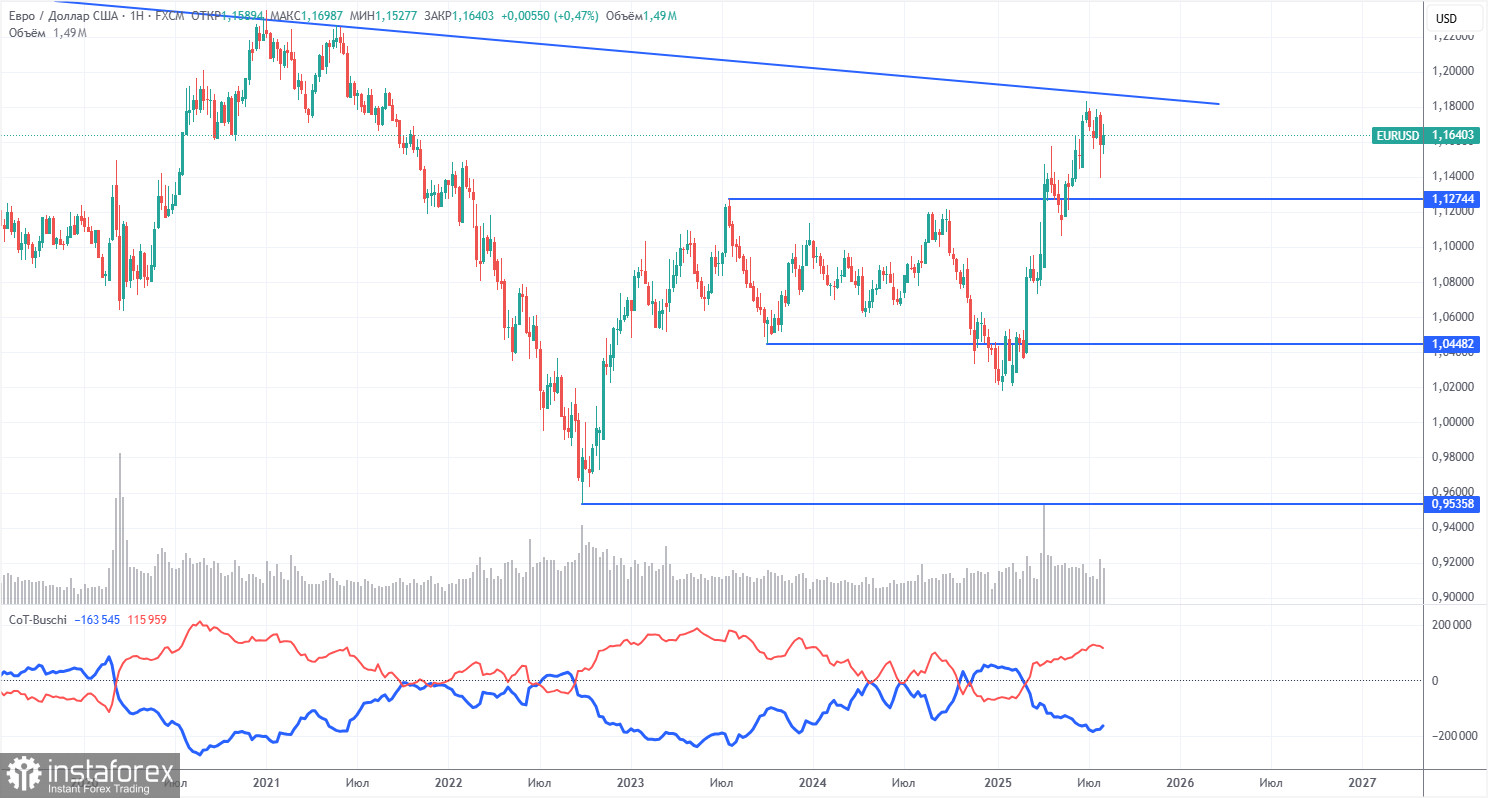
The latest COT report is dated August 5. As the chart above clearly shows, the net position of non-commercial traders had been bullish for a long time, while bears barely entered the dominance zone at the end of 2024 but quickly lost it. Since Trump took office, the dollar has only been falling. We cannot say with 100% certainty that the decline of the U.S. currency will continue, but current global developments point precisely in that direction.
We still see no fundamental factors for strengthening the euro, but there remains one very significant factor for the dollar's decline. The long-term downtrend remains intact, but at this point, what does it matter where the price has moved over the past 17 years? Once Trump ends his trade wars, the dollar may start to rise, but recent events have shown that the war will continue in one form or another.
The positioning of the red and blue indicator lines still signals a bullish trend. During the last reporting week, the number of long positions among the "Non-commercial" group decreased by 1,400, while short positions increased by 5,900. As a result, the net position fell by 7,300 contracts over the week — an insignificant change.
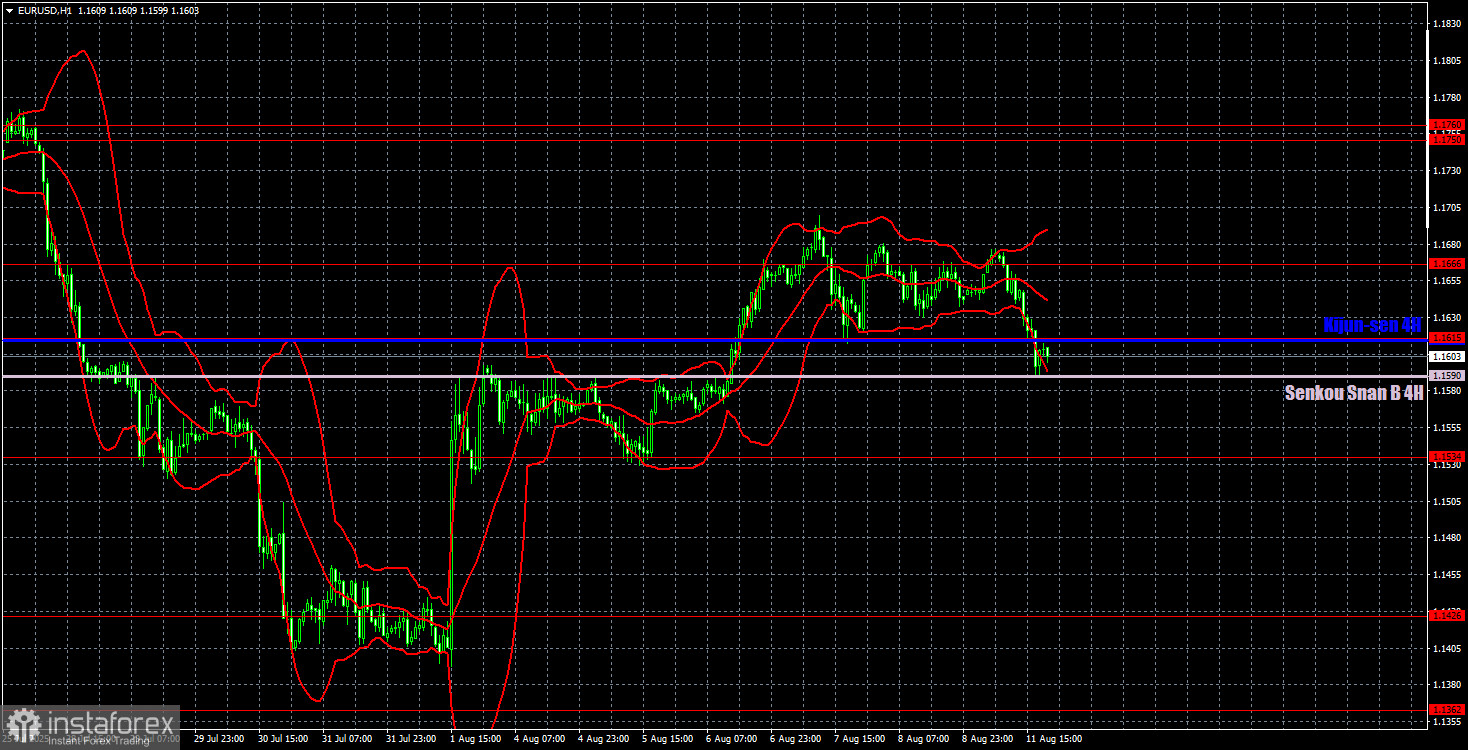
On the hourly timeframe, the EUR/USD pair continues to form a new upward trend. On the hourly TF, the price is above the Senkou Span B line, and on the daily TF, it has bounced from the Senkou Span B line. Thus, considering both technical and fundamental factors, there are now far more reasons to expect the dollar to continue falling than for the euro to decline. Trump continues to take steps that escalate the trade war.
For August 12, we highlight the following trading levels: 1.1092, 1.1147, 1.1185, 1.1234, 1.1274, 1.1362, 1.1426, 1.1534, 1.1615, 1.1666, 1.1750–1.1760, 1.1846–1.1857, as well as the Senkou Span B (1.1590) and Kijun-sen (1.1615) lines. The Ichimoku indicator lines may shift during the day, which should be taken into account when identifying trading signals. Remember to set a Stop Loss to breakeven once the price moves 15 pips in the right direction — this will protect against potential losses if the signal turns out to be false.
On Tuesday, the Eurozone will release secondary ZEW Economic Sentiment indices, while the US will publish the highly anticipated inflation report. We believe the market will react to the inflation report, but the report itself no longer has the same impact on the Fed's monetary policy as before.
On Tuesday, quotes may continue to rise based on a rebound from the Senkou Span B line (daily TF) and a rebound from the Senkou Span B line on the hourly TF. Therefore, we remain focused on long positions with a target of 1.1750–1.1760. A consolidation below the Senkou Span B line will allow for opening short positions with a target of 1.1534 intraday.


