See also

 19.08.2025 11:05 AM
On Monday, the EUR/USD pair reversed in favor of the U.S. currency and returned to the support zone of 1.1637–1.1645. A rebound of quotes from this zone will favor the euro and a resumption of growth toward the 76.4% retracement level at 1.1695, since the "bullish" trend is not yet complete. A consolidation of quotes below the 1.1637–1.1645 zone will allow traders to expect a continued decline toward the 50.0% Fibonacci level at 1.1590.
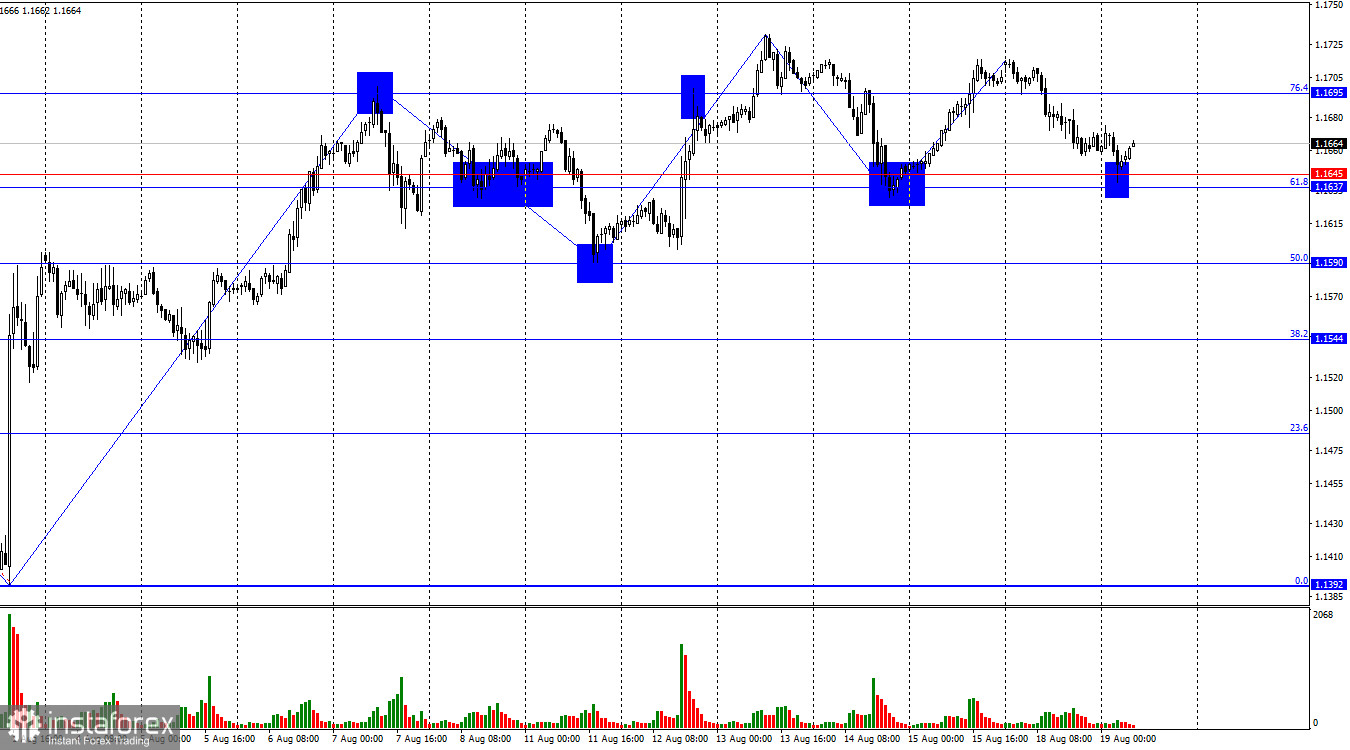
The wave situation on the hourly chart remains simple and clear. The last completed upward wave did not break the high of the previous wave, and the last downward wave did not break the previous low. Thus, at this time the trend can still be considered "bullish." The latest labor market data and the changed outlook for Fed monetary policy support the bulls.
On Monday, the news background was absent. There were no economic reports in the Eurozone or the U.S. during the day. In the evening, talks were held at the White House between the presidents of Ukraine and the U.S., with the participation of European Union leaders. The talks were successful, and a trilateral meeting involving the leaders of the U.S., Ukraine, and Russia may soon take place, which could become a starting point for ending the conflict. It is worth noting that the Ukrainian and Russian sides have recently significantly softened their rhetoric and no longer demand everything in exchange for nothing. Thus, the chances of achieving peace are rising sharply. However, traders are not particularly interested in this information yet. The economy and the trade war remain the top priorities. Since the economic background is currently absent and Donald Trump is busy resolving the war in Ukraine, traders prefer not to rush events and simply wait calmly.
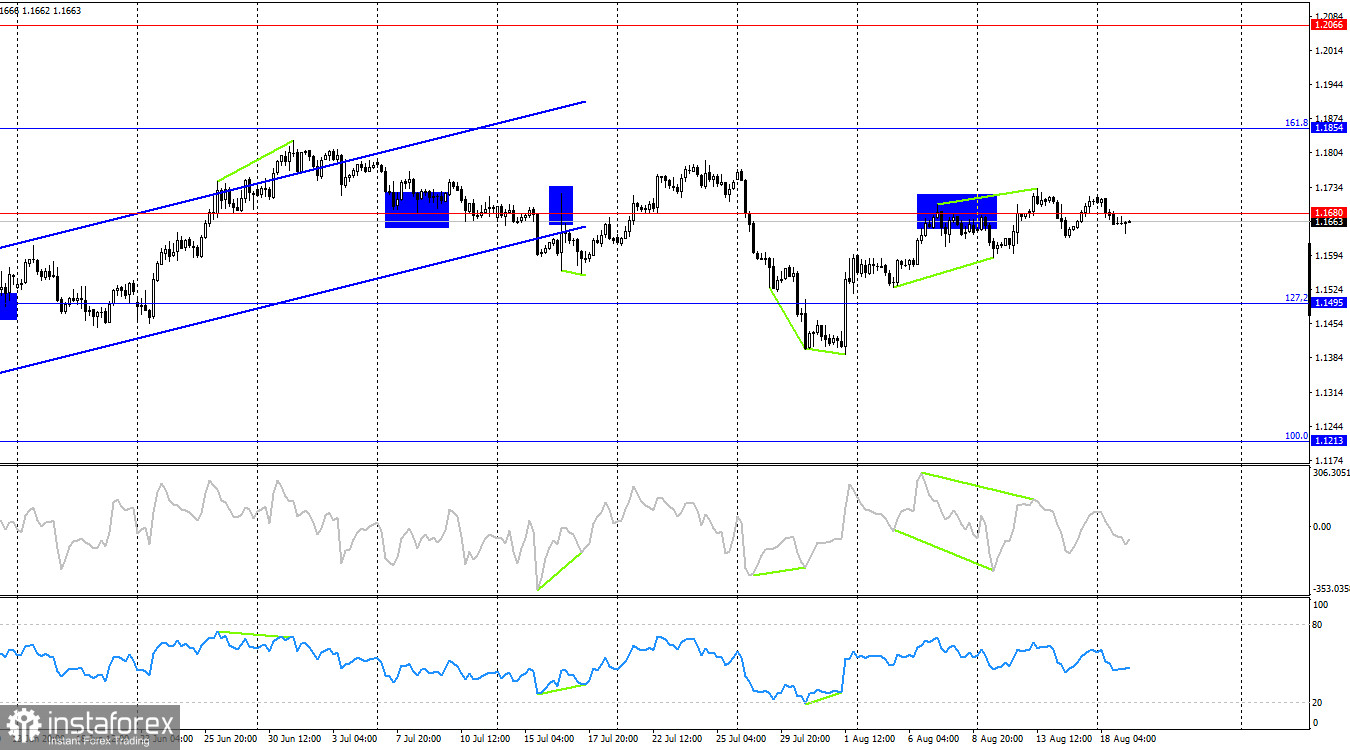
On the 4-hour chart, the pair made another reversal in favor of the U.S. currency and consolidated below the 1.1680 level. This level has been crossed very often recently, so I do not recommend focusing on it. The picture on the hourly chart is much more informative and clear. No looming divergences are observed on any indicator today.
Commitments of Traders (COT) report:
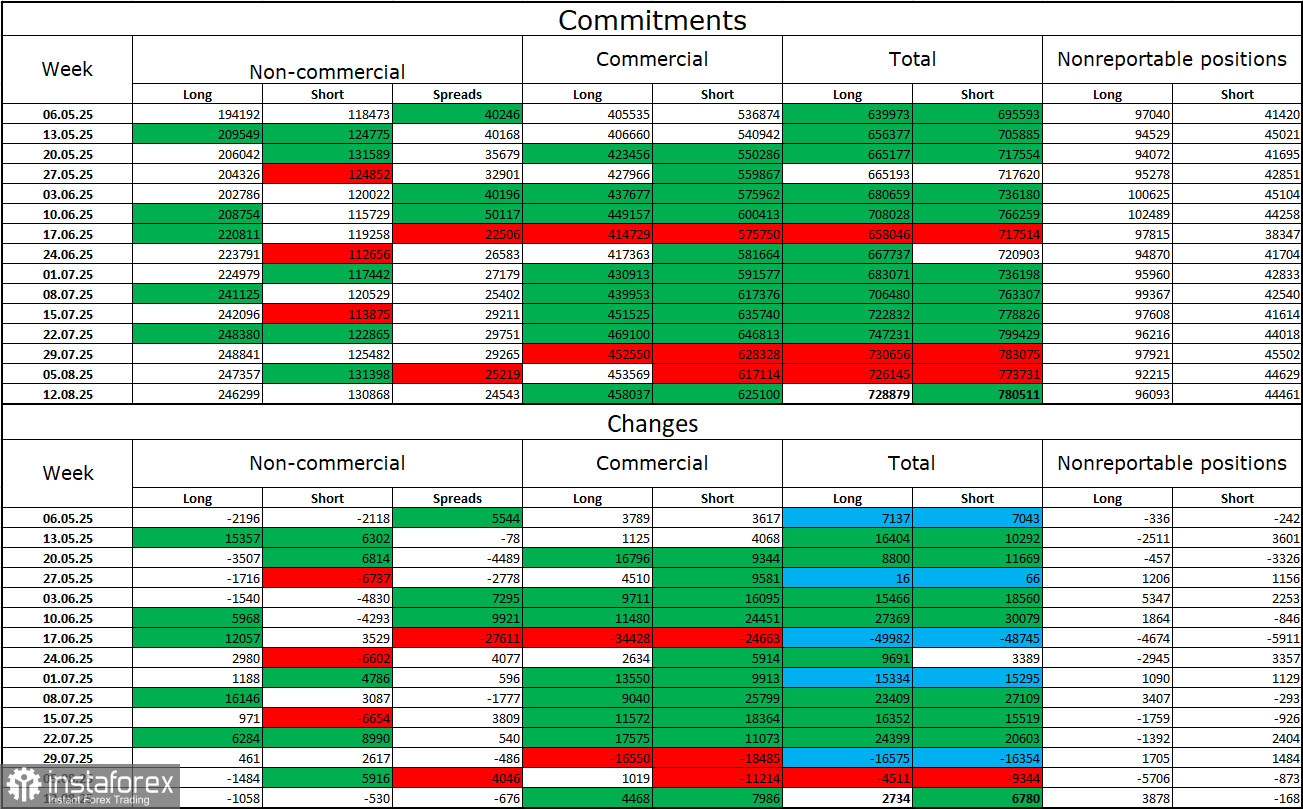
During the last reporting week, professional players closed 1,058 long positions and 530 short positions. The sentiment of the "Non-commercial" group remains "bullish" thanks to Donald Trump and is strengthening over time. The total number of long positions held by speculators now amounts to 246,000, while short positions stand at 131,000. The gap is almost twofold. In addition, note the number of green cells in the table above. They reflect a strong buildup of positions in the euro. In most cases, interest in the euro is only growing, while interest in the dollar is falling.
For twenty-seven consecutive weeks, large players have been reducing short positions and increasing long ones. Donald Trump's policy remains the most significant factor for traders, as it can cause many problems that will be long-term and structural for America. Despite the signing of several important trade agreements, some key economic indicators are showing a decline.
News calendar for the U.S. and Eurozone:
On August 19, the economic calendar contains two entries, neither of which is of particular importance. The impact of the news background on market sentiment on Tuesday will be extremely weak.
Forecast for EUR/USD and trading advice:
Sales of the pair were possible after a close on the hourly chart below the 1.1695 level with targets at 1.1637–1.1645 and 1.1590. The first target has been reached. Today, selling is possible if the pair closes below the 1.1637–1.1645 zone. Buying can be considered if the pair rebounds from the 1.1637–1.1645 zone on the hourly chart with targets at 1.1695 and 1.1789.
Fibonacci grids are built from 1.1789–1.1392 on the hourly chart and from 1.1214–1.0179 on the 4-hour chart.


