See also

 20.08.2025 03:38 AM
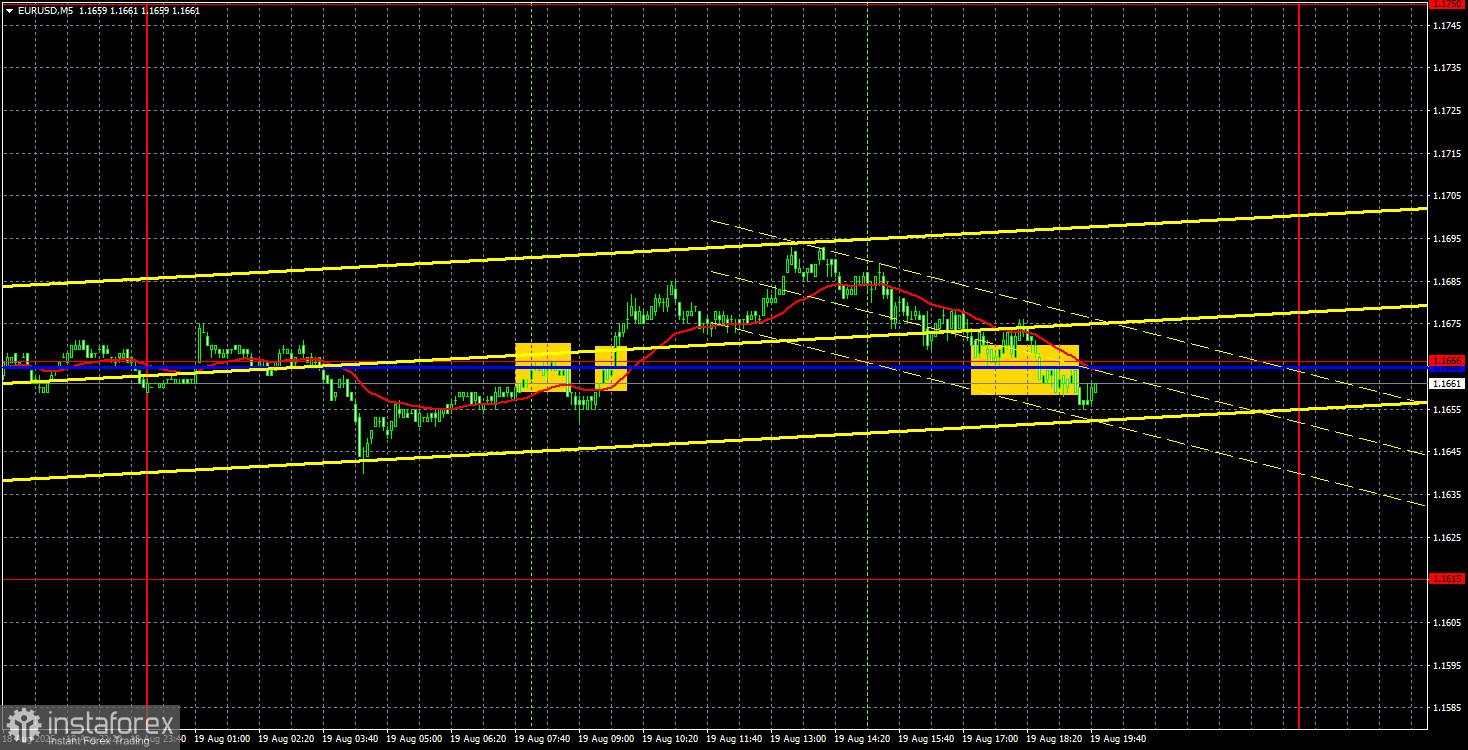
The EUR/USD currency pair continued to trade on Tuesday with minimal volatility, without support from macroeconomic or fundamental background, and strictly sideways. As we expected, the U.S. construction sector reports did not trigger any reaction from traders. Therefore, throughout the day, the pair kept moving sideways, while the market continued to wait for new growth or decline drivers.
At this stage, however, it is very difficult to expect strong downside drivers. This week indeed has very few reports, and among them, even fewer are important. For example, today the Eurozone inflation report will be published. It may sound significant, but it will be the second estimate for July, which usually does not differ from the first. Of course, exceptions exist, but most likely, today we will not see any strong moves in the market either.
From a technical perspective, one might assume that the upward trend has ended. However, let us recall that in a flat, many technical patterns, levels, lines, and references do not work. In other words, breaking the upward trendline under the current circumstances means nothing. Even Ichimoku indicator lines are weak at the moment – the price can cross them back and forth any number of times.
On the 5-minute TF, several trading signals were formed, with their quality visible on the chart above. The signals themselves were not the worst, but what kind of profit can be expected when the market makes no moves?
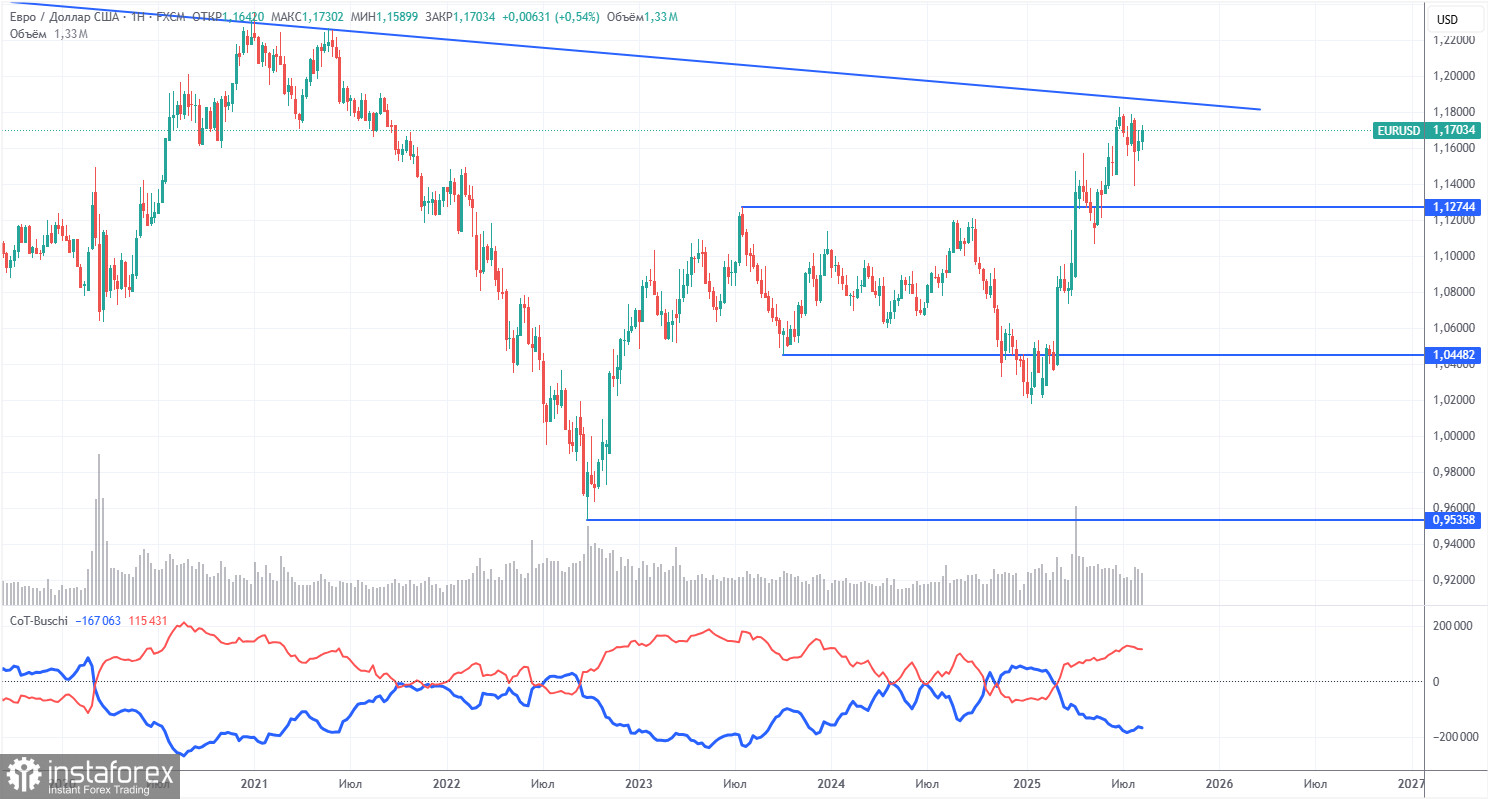
The latest COT report is dated August 12. The chart above shows clearly that the net position of non-commercial traders has long been bullish, while the bears only briefly gained an advantage at the end of 2024 before quickly losing it. Since Trump took office as U.S. president, only the dollar has been falling. We cannot say with 100% certainty that the decline of the American currency will continue, but the current global developments suggest exactly that scenario.
We still see no fundamental factors supporting the strengthening of the European currency, but there remains one very weighty factor for the decline of the U.S. dollar. The global downtrend is still intact, but what significance does it have now where the price moved over the past 17 years? Once Trump ends his trade wars, the dollar may begin to rise, but recent events show that the war will continue in one form or another.
The positioning of the red and blue indicator lines continues to signal the preservation of a bullish trend. During the last reporting week, the number of longs in the "non-commercial" group decreased by 1,000, while shorts decreased by 500. Accordingly, the net position declined by 500 contracts over the week, which is a negligible change.
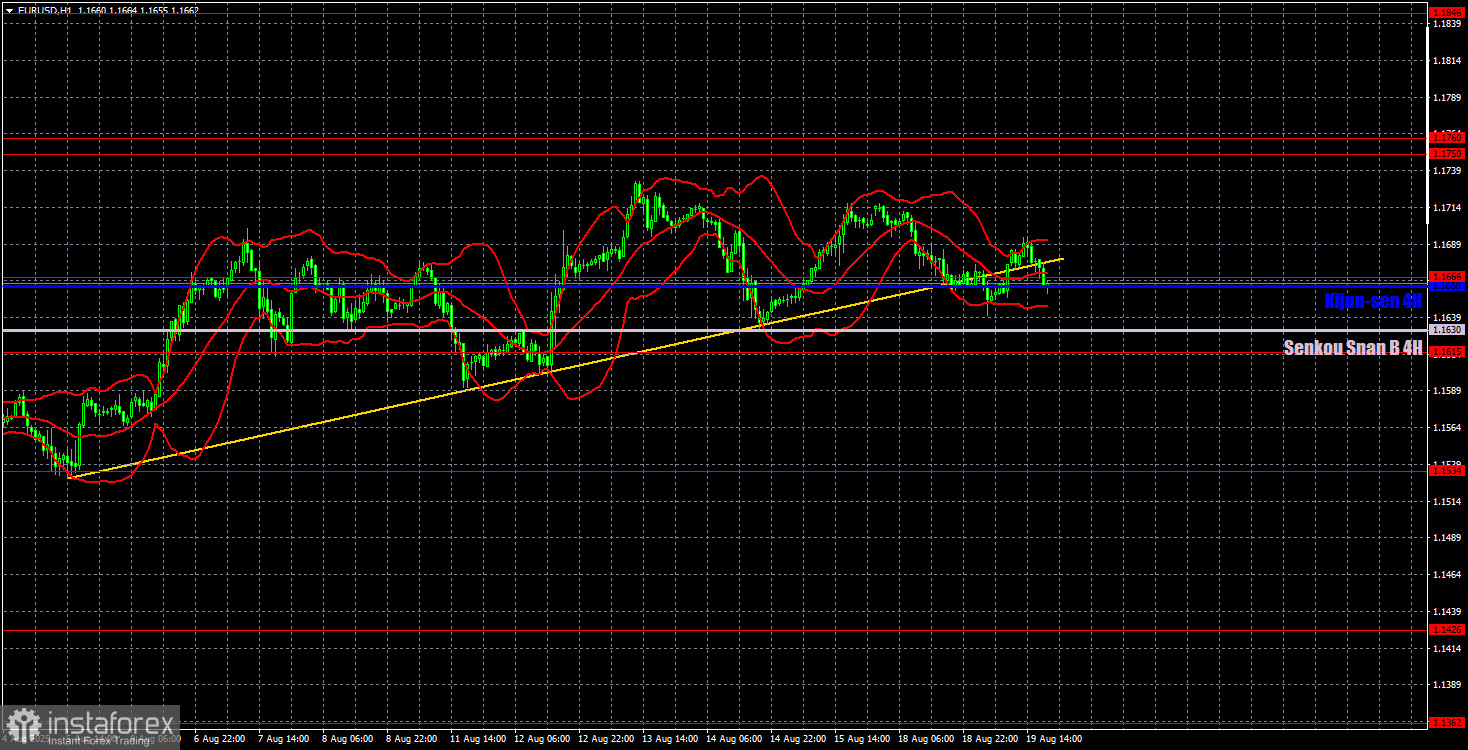
On the hourly timeframe, EUR/USD continues to form a new upward trend. The latest upward leg started after the price bounced off the Senkou Span B line on the daily TF. Thus, the dollar corrected very technically, while the upward trend was preserved. At present, the market is resting, clearly waiting for important events. The market is flat, so we must wait for its completion.
For August 20, we highlight the following levels for trading: 1.1092, 1.1147, 1.1185, 1.1234, 1.1274, 1.1362, 1.1426, 1.1534, 1.1615, 1.1666, 1.1750–1.1760, 1.1846–1.1857, as well as the Senkou Span B line (1.1630) and Kijun-sen (1.1660). Ichimoku indicator lines may shift throughout the day, which should be taken into account when identifying trading signals. Do not forget to set the Stop Loss to breakeven if the price moves 15 pips in the right direction. This will protect against potential losses if the signal turns out to be false.
On Wednesday, the macroeconomic calendar once again contains no noteworthy events. The Eurozone will release the second inflation estimate for July, which is unlikely to attract much attention. Thus, everything points to yet another "flat day."
On Wednesday, the pair may continue trading with minimal volatility and sideways movement. The macroeconomic and fundamental background will again be absent, so the only hope remains Donald Trump.


