See also

 25.08.2025 11:09 AM
Trend Analysis.
This week, from the level of 1.3525 (the close of the last weekly candle), the price may continue moving upward with the target at 1.3593 – the upper fractal (yellow dotted line). Upon testing this level, the price may pull back downward toward the 14.6% retracement level at 1.3527 (yellow dotted line).
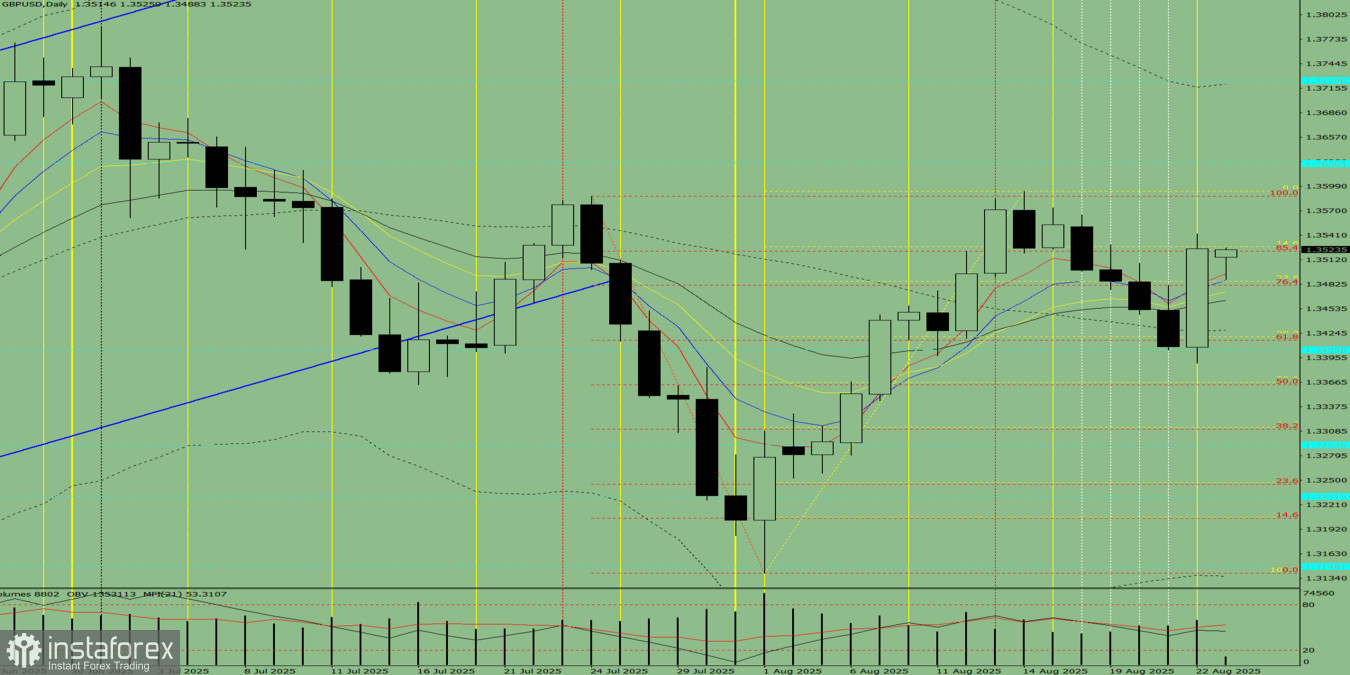
Fig. 1 (weekly chart).
Comprehensive Analysis:
Conclusion from comprehensive analysis: upward trend.
Overall result for the GBP/USD weekly chart candle: The price during the week is most likely to follow an upward trend, with no lower shadow on the weekly white candle (Monday – upward) and the presence of an upper shadow (Friday – downward).
Alternative Scenario: From the level of 1.3525 (the close of the last weekly candle), the price may begin an upward movement with the target at 1.3626 – the historical resistance level (blue dotted line). Upon reaching this line, the price may move downward with the target at 1.3593 – the upper fractal (yellow dotted line).
You have already liked this post today
*The market analysis posted here is meant to increase your awareness, but not to give instructions to make a trade.


