See also

 03.09.2025 03:37 AM
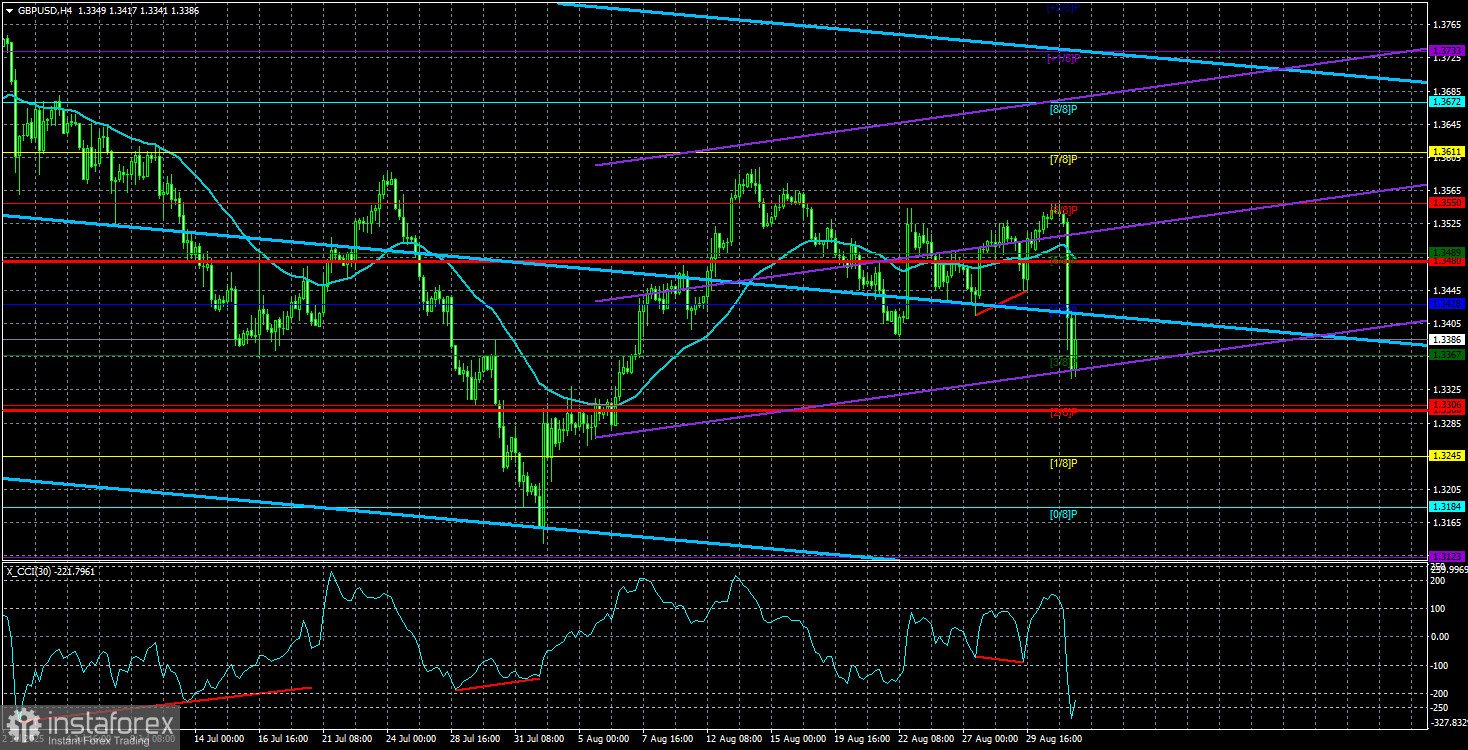
On Tuesday, the GBP/USD currency pair crashed by 140 points in just one hour. Is there anyone in the world who predicted such a move? And the most critical question—what was the basis for the sudden surge in the US dollar? Is Donald Trump no longer the president of the United States? Did the Fed announce a key interest rate hike? Has a new war broken out in the Middle East? Of course, these are rhetorical questions.
What is clear is that there was some cause behind the GBP/USD pair's sharp fall. But what exactly it was, perhaps none of us will ever know. Maybe some information will eventually emerge, but it's clear that major players didn't start aggressively buying dollars without a reason.
Thus, there are two possibilities. Either there is a reason we are unaware of, or this is manipulation aimed at stirring up the market to show that we're about to move lower, while in reality, a new wave of a global uptrend may be about to begin. Ask yourself, even hypothetically, what reasons currently exist for strengthening the US currency? Absolutely nothing has improved for the dollar in recent months. If the dollar was previously falling off a cliff, what would make it rally now?
Maybe it's still about insider information. Perhaps a select group of market participants knows that Friday's NonFarm Payrolls report will show a significant gain, offsetting the last three months of poor data, and therefore will significantly reduce the likelihood of the Fed easing policy in September. Well, in that case, we just have to wait for Friday and see if that's true. But even if it is, that factor would already be "priced in." Thus, if Friday's NFPs are strong, we could see a fall in the dollar, not growth.
Generally, Tuesday's movements in the pair look a lot like manipulation. On the daily timeframe, you can clearly see that the price remains within an uptrend, and, as we've established, there were no reasons for a drop on Tuesday. Thus, even if we eventually see a new round of global correction with the price falling below the previous local low (1.3140), our outlook remains unchanged—further US dollar depreciation in the medium term.
A major player may want to continue selling the US currency to buy euros and pounds, but someone in the market must be willing to buy them. And who's selling euros and pounds now, if these two currencies are in an uptrend? Thus, there may be a "liquidity grab" underway. This phenomenon is well known if you use the ICT strategy. It involves consuming retail traders' stop losses, which serve as liquidity for a big player to open long positions. In that case, again, this is about manipulation.
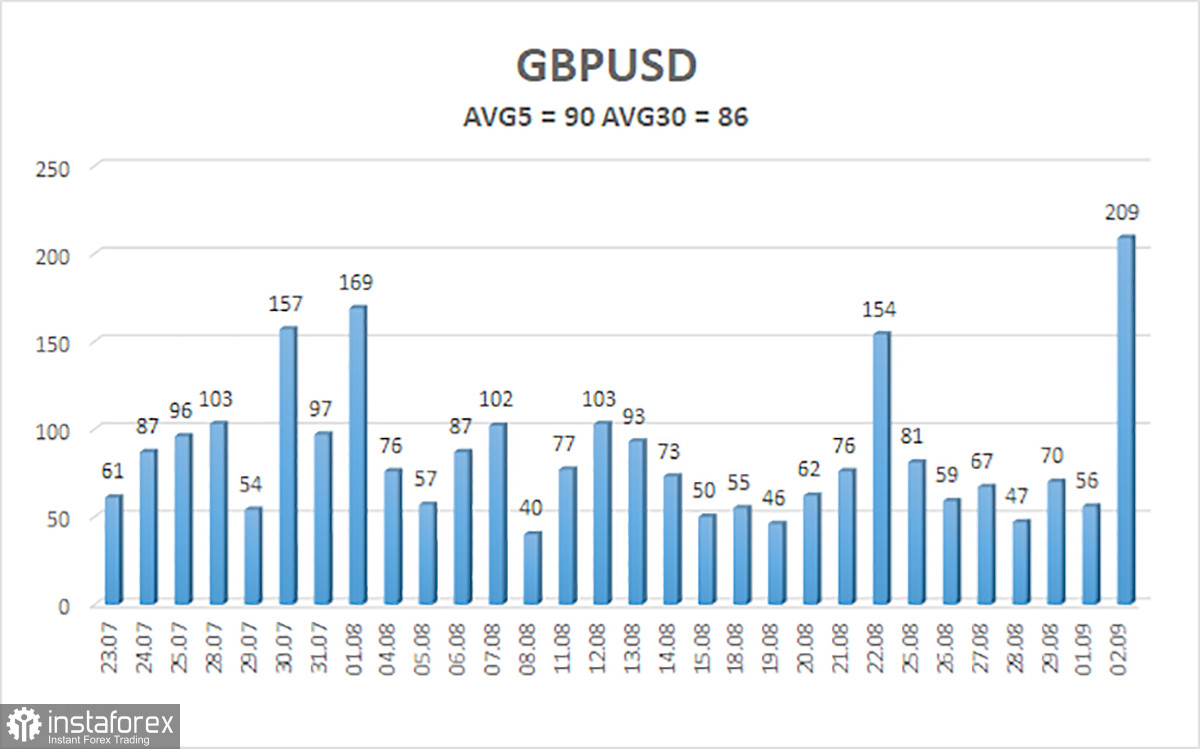
The average volatility for GBP/USD over the past five trading days is 90 pips. For the pound/dollar pair, that is considered "average." On Wednesday, September 3, we expect movement within a range bounded by levels 1.3300 and 1.3480. The upper channel of linear regression is heading upward, which clearly indicates an uptrend. The CCI indicator has twice entered oversold territory, once more warning of a resumption of the upward trend.
S1 – 1.3367
S2 – 1.3306
S3 – 1.3245
R1 – 1.3428
R2 – 1.3489
R3 – 1.3550
The GBP/USD currency pair has begun a new round of downward correction. In the medium term, Trump's policies will likely continue to put pressure on the dollar. Thus, long positions targeting 1.3611 and 1.3672 remain much more relevant if the price is above the moving average. If the price is below the moving average, small shorts may be considered for purely technical reasons. From time to time, the US currency experiences corrections, but for a true trend strengthening, it needs real evidence of the end of the global trade war or other significant positive factors.


