See also

 23.09.2025 11:15 AM
Trend Analysis (Fig. 1).
On Tuesday, from the level of 1.3510 (yesterday's daily close), the market may start moving downward with a target of 1.3465 – the 61.8% retracement level (blue dotted line). Upon testing this level, the price may then move upward toward 1.3482 – the 61.8% retracement level (red dotted line).
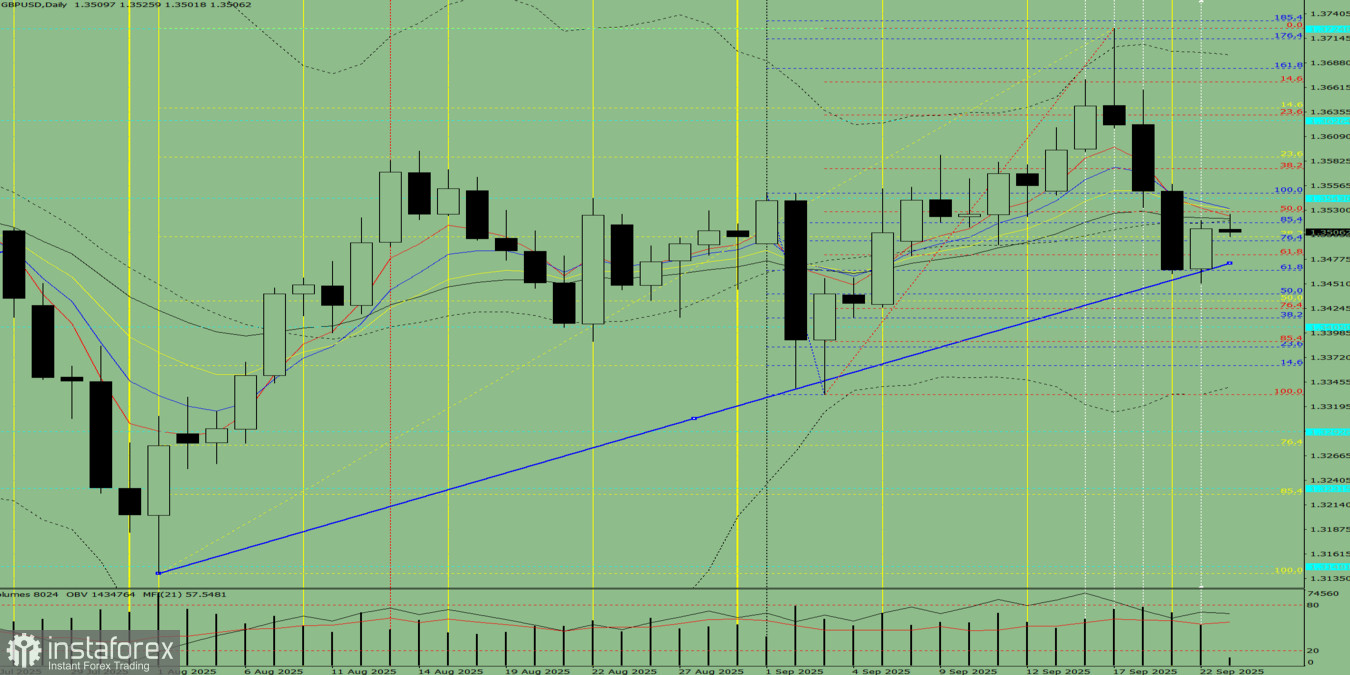
Fig. 1 (daily chart).
Comprehensive Analysis:
Overall conclusion: downward trend.
Alternative scenario: from the level of 1.3510 (yesterday's daily close), the price may start moving downward with a target of 1.3440 – the 50% retracement level (blue dotted line). Upon testing this level, the price may then move upward toward 1.3465 – the 61.8% retracement level (blue dotted line).
You have already liked this post today
*The market analysis posted here is meant to increase your awareness, but not to give instructions to make a trade.


