See also

 25.09.2025 10:13 AM
Trend analysis (Fig. 1).
On Thursday, from the 1.3442 level (yesterday's daily close), the market may continue moving downward toward 1.3383 – the 23.6% retracement level (blue dotted line). From this level, the price may rebound upward toward 1.3405 – a historical resistance level (light blue dotted line).
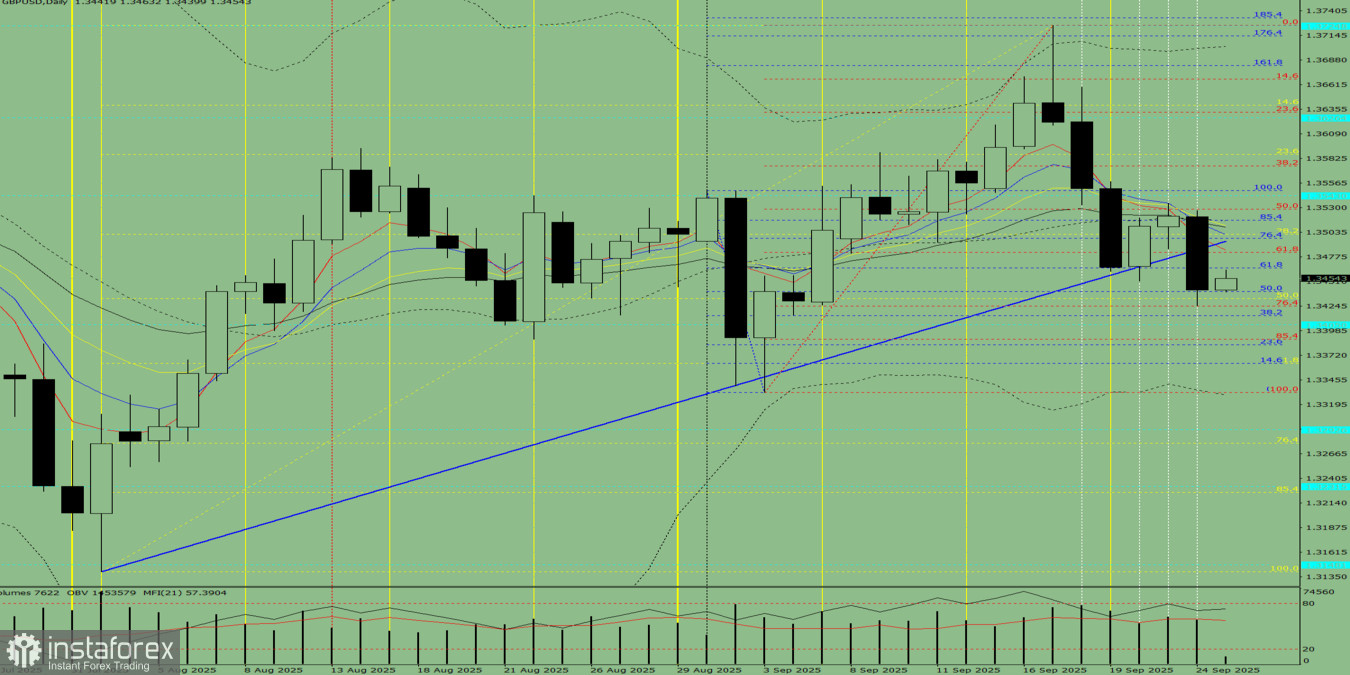
Fig. 1 (daily chart).
Comprehensive analysis:
Overall conclusion: downward trend.
Alternative scenario: From the 1.3442 level (yesterday's daily close), the price may start moving downward toward 1.3405 – a historical resistance level (light blue dotted line). From this level, the price may rebound upward toward 1.3414 – the 38.2% retracement level (blue dotted line).
You have already liked this post today
*The market analysis posted here is meant to increase your awareness, but not to give instructions to make a trade.


