See also

 26.09.2025 09:30 AM
Trend Analysis (Fig. 1)
On Friday, the market may continue moving downward from the 1.3340 level (yesterday's daily candle close), targeting 1.3293 – a historical support level (blue dashed line). Upon testing this level, a corrective upward movement is possible, with a target of 1.3322 – the lower fractal (daily candle from September 25, 2025).
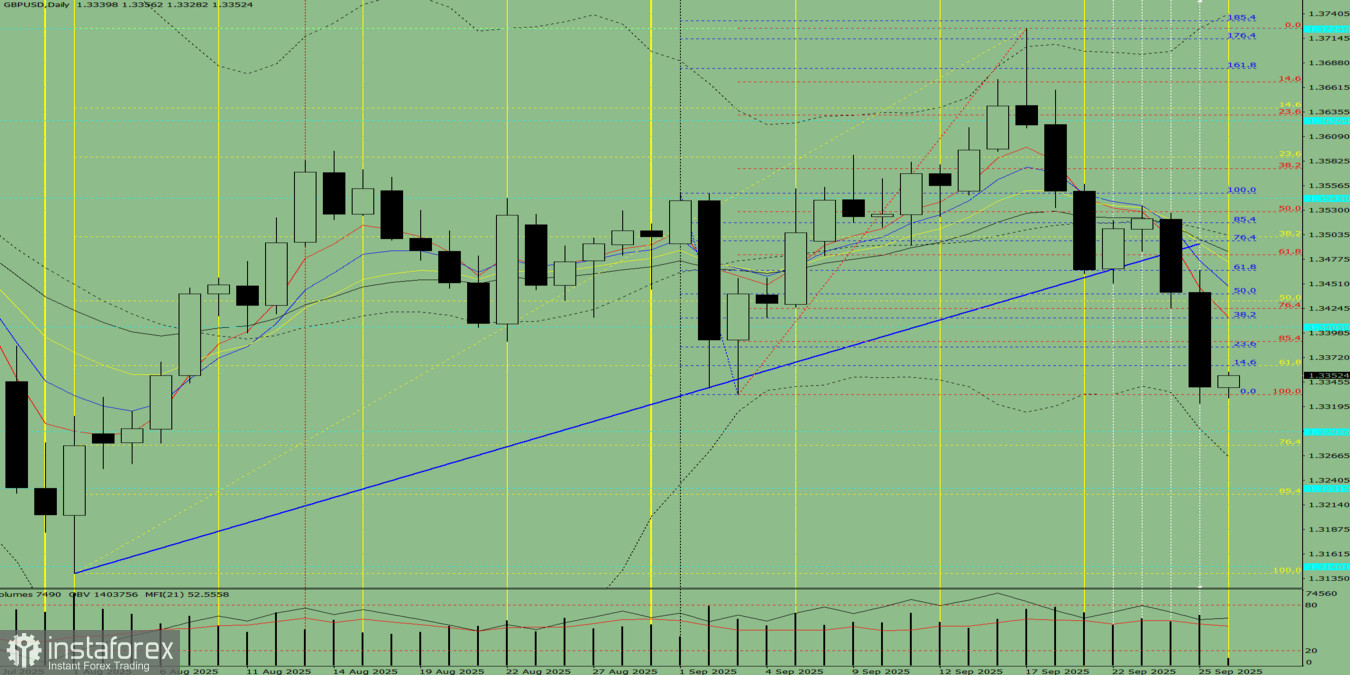
Fig. 1 (daily chart)
Comprehensive Analysis:
Overall Conclusion: Downward trend.
Alternative Scenario:
The price from the 1.3340 level (yesterday's daily candle close) may continue to move lower, targeting 1.3278 – the 76.4% retracement level (yellow dashed line). Upon testing this level, a corrective upward movement is possible, targeting 1.3293 – the historical support level (blue dashed line).
You have already liked this post today
*The market analysis posted here is meant to increase your awareness, but not to give instructions to make a trade.


