See also

 29.09.2025 10:02 AM
EUR/USD
Brief analysis:
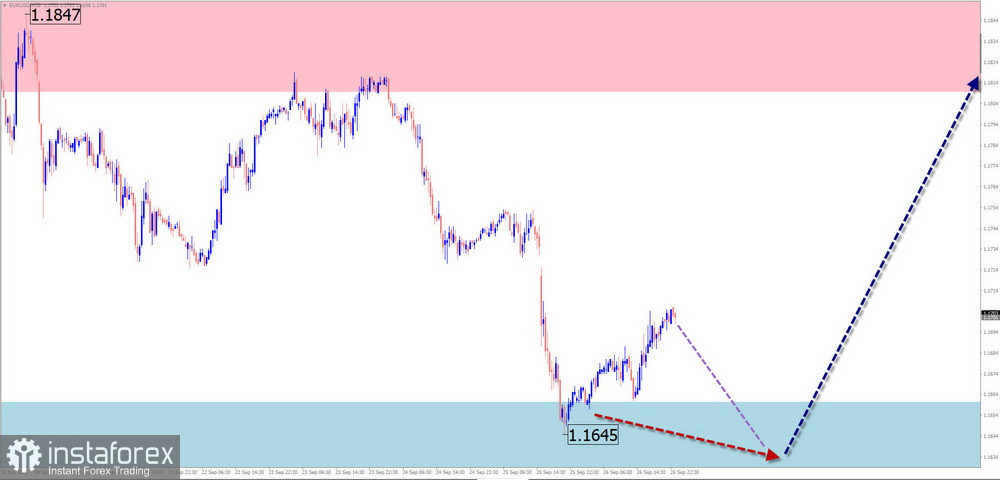
The upward trend has been setting the main direction in the euro's major pair since February this year. The latest unfinished segment started in late July. From the lower boundary of a strong potential reversal zone, the price has continued its sideways movement that began a month and a half ago. The structure shows the correction remains incomplete.
Weekly forecast:
In the coming days, the euro is likely to continue its sideways movement along the support zone. Later, conditions may form for a reversal and the start of an upward move. The rise of the major could extend to the calculated resistance levels. A breakout above them within the weekly period is unlikely.
Potential reversal zones
Resistance:
Support:
Recommendations
USD/JPY
Brief analysis:
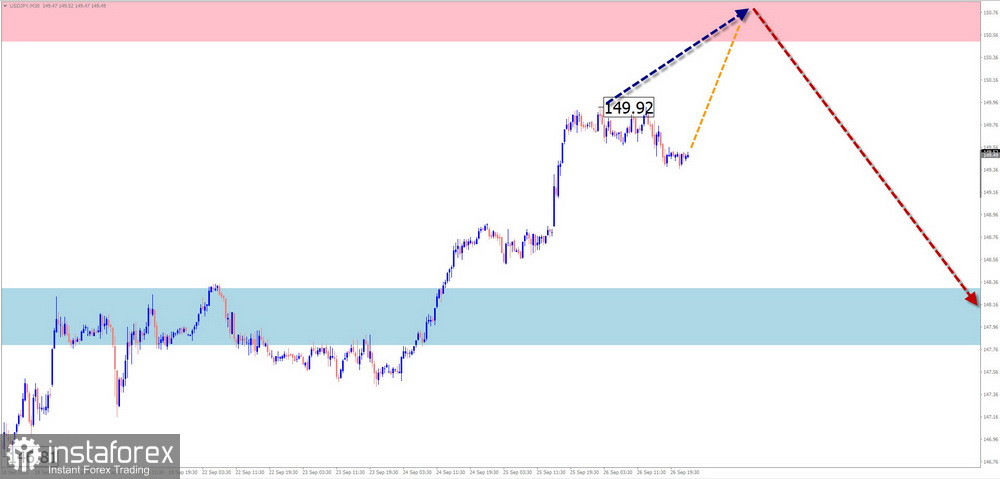
On the yen chart, an upward wave has been developing since April. In the broader wave model, this segment is correcting the downward trend. Its structure is approaching completion of the final part (C). Prices are nearing the lower boundary of the preliminary target zone.
Weekly forecast:
In the coming days, the most likely scenario is an upward move towards the calculated resistance zone. Towards the weekend, higher volatility, reversal, and the start of a decline are expected. The release of important economic data could serve as a timing reference.
Potential reversal zones
Resistance:
Support:
Recommendations
GBP/JPY
Brief analysis:
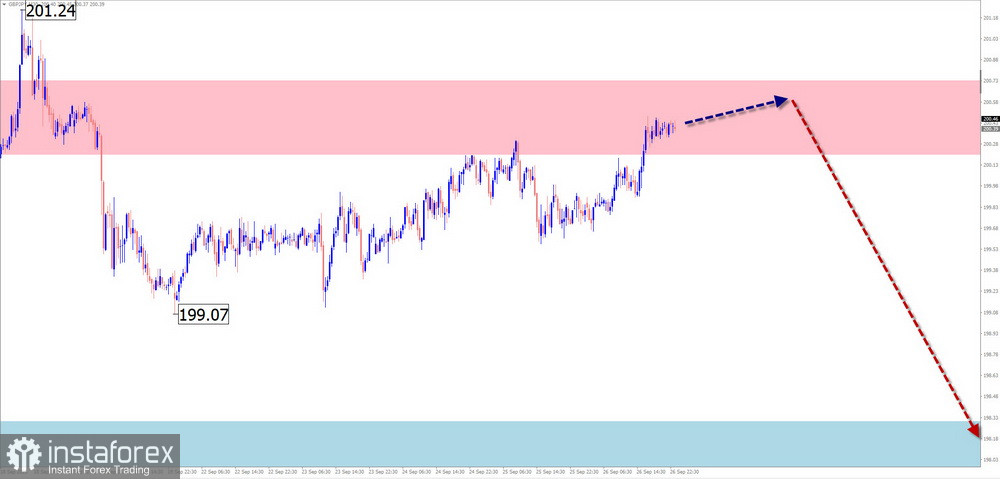
In the pound/yen pair, an upward wave started in August. On a larger scale, this segment marks the beginning of the next wave of the dominant uptrend. Within its structure, an intermediate correction (B) has been developing over the past two weeks. Last week, a pullback took shape.
Weekly forecast:
In the coming days, the pair is expected to show mostly sideways movement near resistance levels. By the end of the week, the flat phase may finish, leading to a reversal and the start of a decline. Volatility growth may coincide with key news releases.
Potential reversal zones
Resistance:
Support:
Recommendations
USD/CAD
Brief analysis:
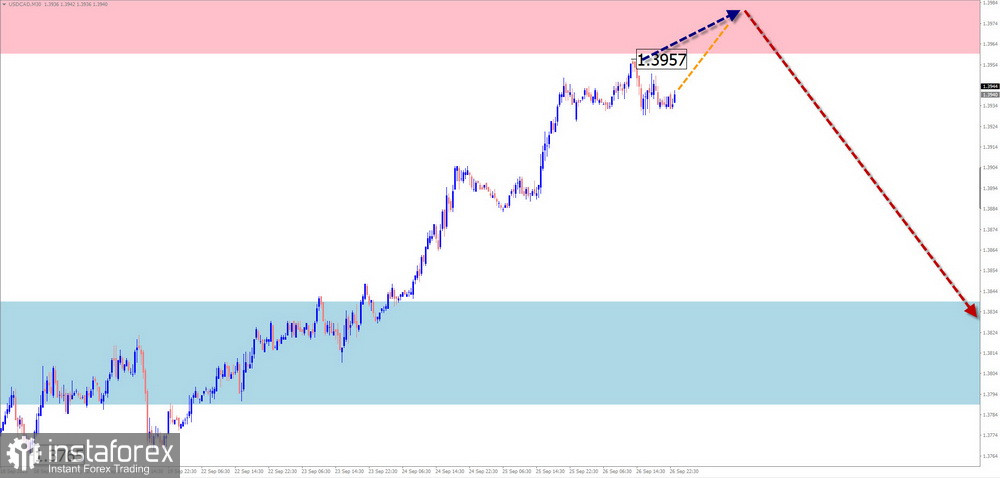
The current wave formation on the Canadian dollar chart is upward, starting from mid-June this year. It represents the corrective part (B) within a larger wave model. The wave structure looks completed. No imminent reversal signals are visible on the chart.
Weekly forecast:
In the coming days, a sideways movement is highly probable. Pressure on the resistance boundary is possible. In the second half of the week, a reversal and resumption of the pair's downtrend can be expected. The calculated support marks the lower boundary of the expected weekly range.
Potential reversal zones
Resistance:
Support:
Recommendations
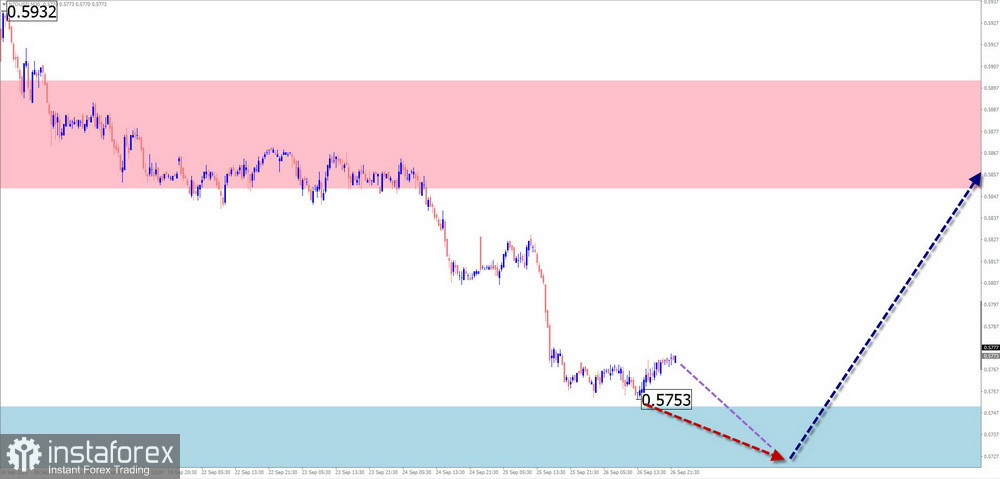
NZD/USD
The New Zealand dollar's major pair has been trending downward for the past three months. This segment corrects the previous trend. Last week, the price reached the lower boundary of a strong potential reversal zone. No clear reversal signals have yet appeared.
Weekly forecast:
In the coming days, sideways movement is likely. Brief pressure on the lower support boundary is possible. Later, a reversal and the start of growth in the pair can be expected.
Potential reversal zones
Resistance:
Support:
Recommendations
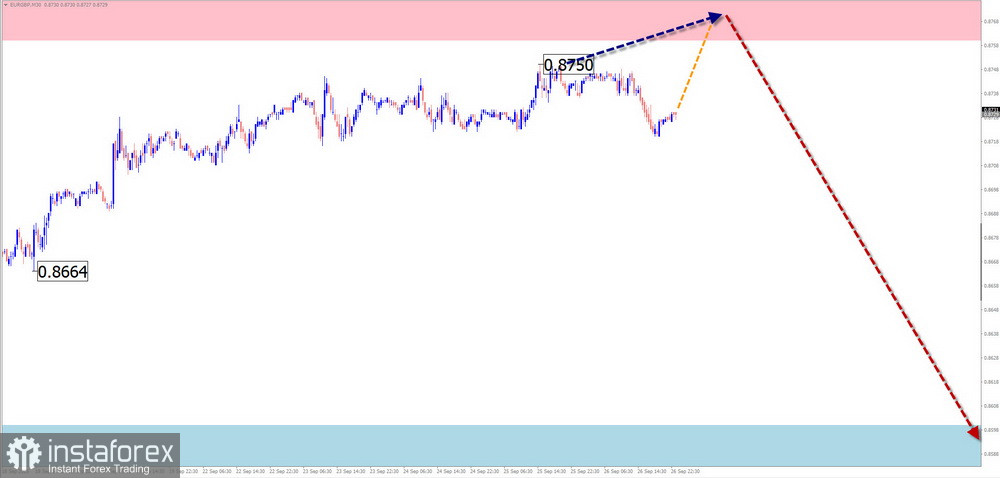
EUR/GBP
Brief analysis:
Since April, a downward wave has been forming in the euro/pound pair. In recent months, a hidden correction (B) has developed within it. Quotes are nearing the lower boundary of the potential reversal zone on the daily timeframe.
Weekly forecast:
An upward move in the pair is expected in the early days of the coming week. Towards the weekend, a reversal and a downward move are highly likely. A sharp spike in volatility cannot be ruled out when the direction changes.
Potential reversal zones
Resistance:
Support:
Recommendations
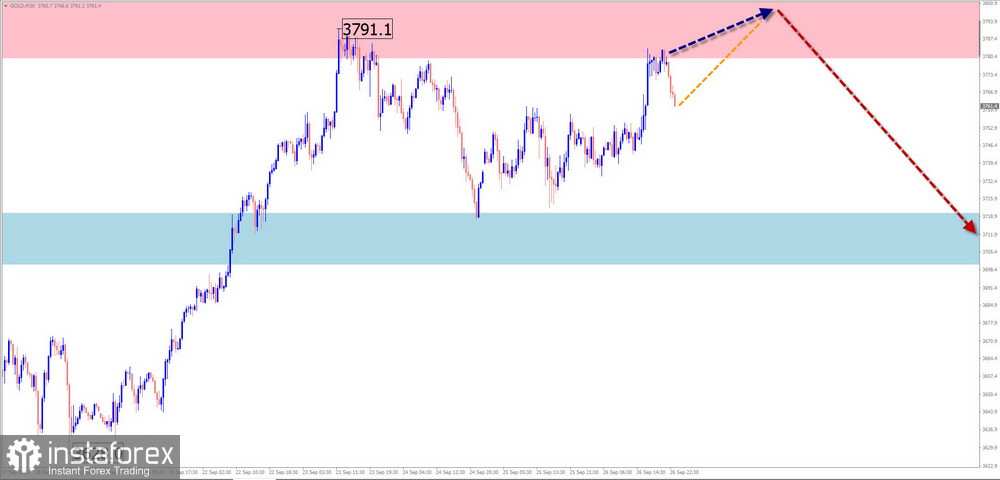
Gold
Analysis:
Gold quotes are hitting historical records. Last week, the price entered a strong weekly potential reversal zone. For several days, gold has been drifting mostly sideways. Within the wave structure, this segment completes a stretched hidden correction.
Forecast:
At the start of the week, sideways movement near resistance is likely. Increased activity and a reversal may be expected closer to the weekend. A reversal is highly likely to coincide with news releases.
Potential reversal zones
Resistance:
Support:
Recommendations
Notes: In simplified wave analysis (SWA), all waves consist of three parts (A-B-C). On each timeframe, only the last unfinished wave is analyzed. Expected movements are shown with dotted lines.
Attention: The wave algorithm does not account for the duration of price moves in time!


