See also

 29.09.2025 10:07 AM
GBP/USD
Brief analysis:
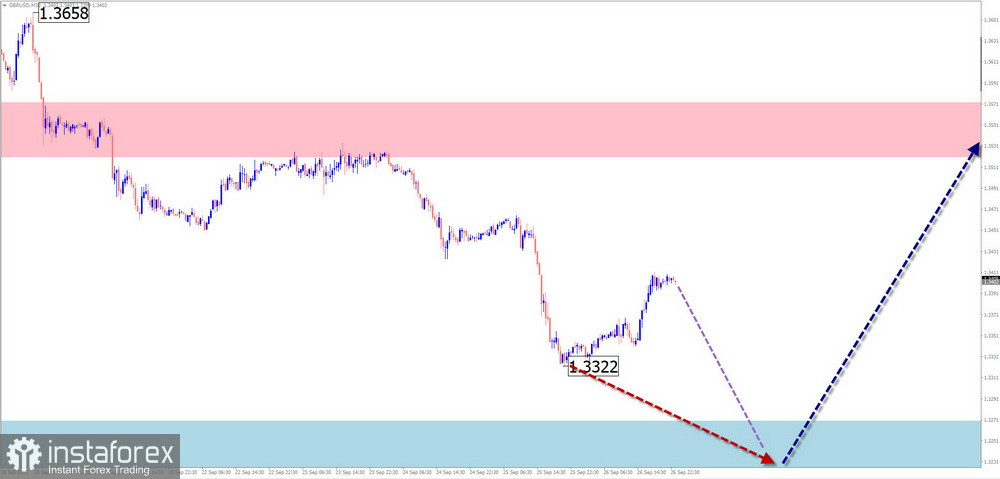
Over the past three months, the major pound pair has been forming the corrective part (B) within the uptrend that has dominated since the beginning of the year. The price is moving sideways along the lower boundary of the potential reversal zone on the daily timeframe. The wave structure does not yet look complete.
Weekly forecast:
In the coming days, the British pound is expected to gradually decline toward support boundaries. In the second half of the week, a reversal and the start of price growth may follow. The resistance zone marks the upper boundary of the pair's expected weekly range.
Potential reversal zones
Resistance:
Support:
Recommendations
AUD/USD
Brief analysis:
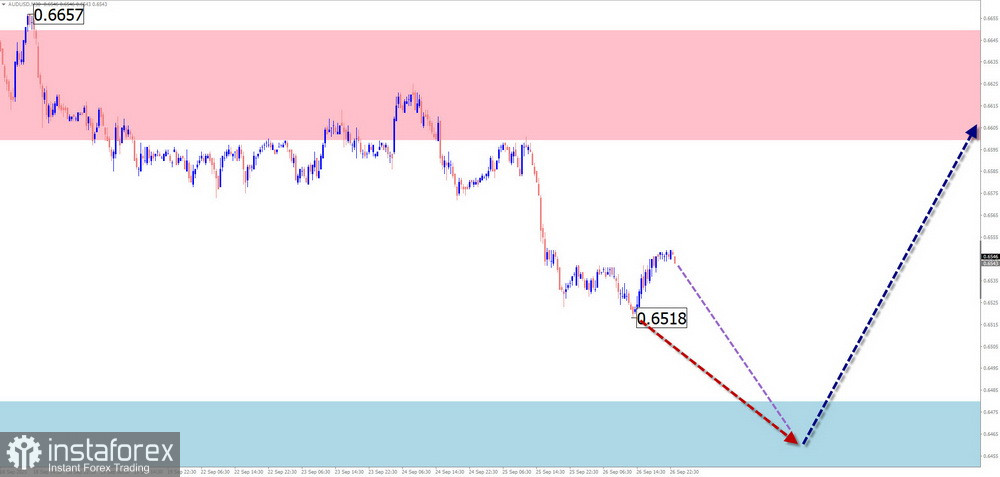
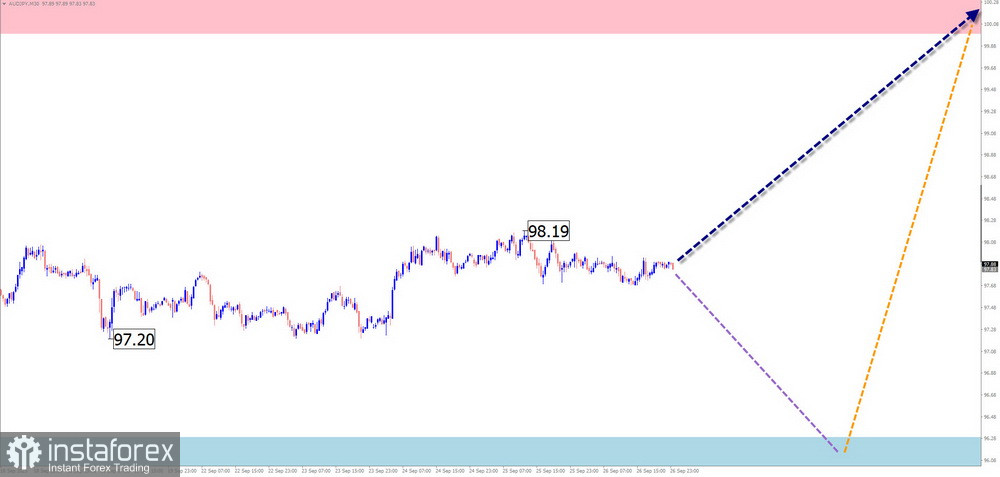
The short-term trend of the Australian dollar has been guided by an upward wave since April. The unfinished downward segment began on September 11. Prices are nearing the upper boundary of strong daily resistance. The correction structure has entered its final phase.
Weekly forecast:
In the coming days, a continuation of the downward move is expected until the decline completes near support. By the end of the week, a reversal and the start of price growth toward calculated resistance can be expected.
Potential reversal zones
Resistance:
Support:
Recommendations
USD/CHF
Brief analysis:
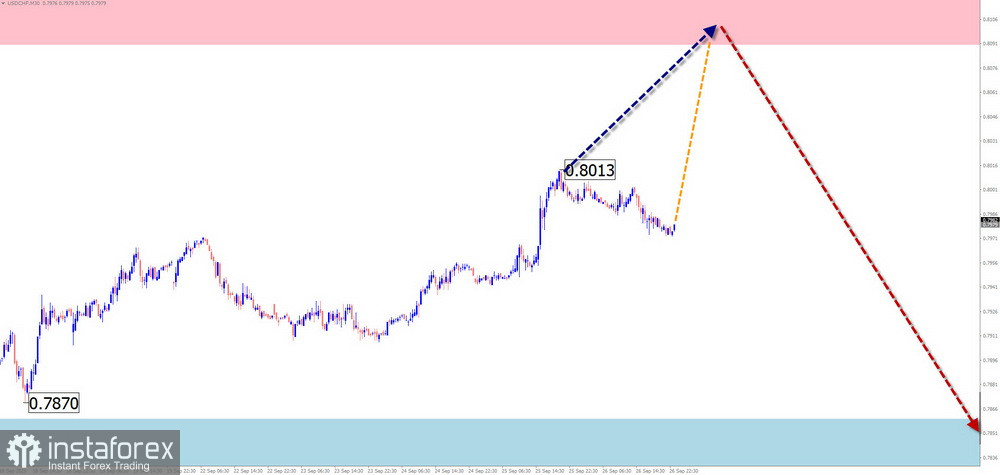
The upward wave in the Swiss franc major, which began in April this year, has reversal potential. Its structure is forming as a stretched flat, with the middle part (B) still incomplete. The price is approaching the upper boundary of the large timeframe potential reversal zone.
Weekly forecast:
At the start of the week, sideways fluctuations along support are expected. Toward the weekend, growth may resume. Any upward move is unlikely to exceed calculated resistance.
Potential reversal zones
Resistance:
Support:
Recommendations
EUR/JPY
Brief analysis:
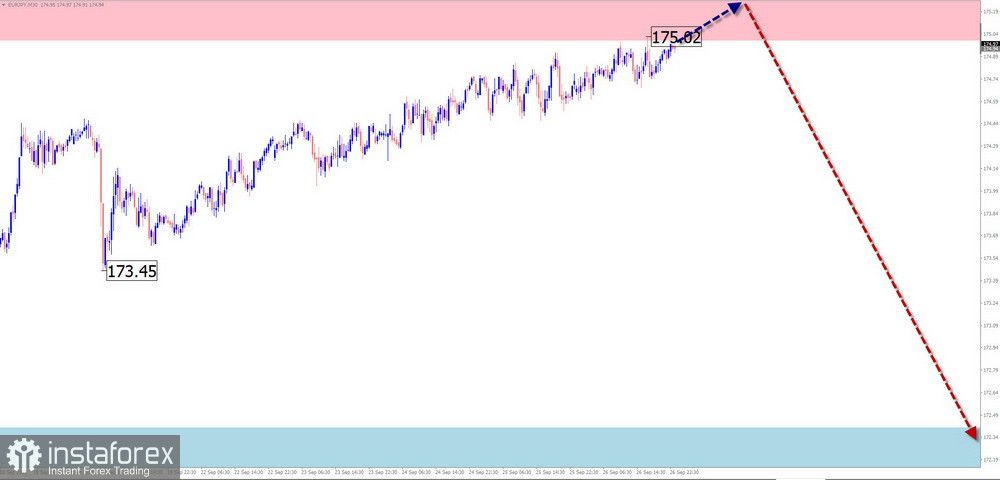
Since February, the euro/yen pair has been in an upward short-term trend. The unfinished wave segment has been developing since August 5. For the past two months, prices have hovered near the strong potential reversal zone on the weekly chart.
Weekly forecast:
In the coming days, sideways movement near resistance is expected. In the second half of the week, volatility is likely to increase, leading to a reversal and a renewed downward move. This is likely to coincide with major economic data releases.
Potential reversal zones
Resistance:
Support:
Recommendations
AUD/JPY
Brief analysis:
Since July this year, the Australian dollar/yen pair has been moving mostly sideways. On a larger scale, this segment forms a descending flat. The structure indicates the final part (C) of the wave is forming.
Weekly forecast:
At the start of the week, a downward move toward calculated support is expected. In that area, conditions for a reversal may form. A resumption of growth is likely by the end of the week.
Potential reversal zones
Resistance:
Support:
Recommendations
Bitcoin
Analysis:
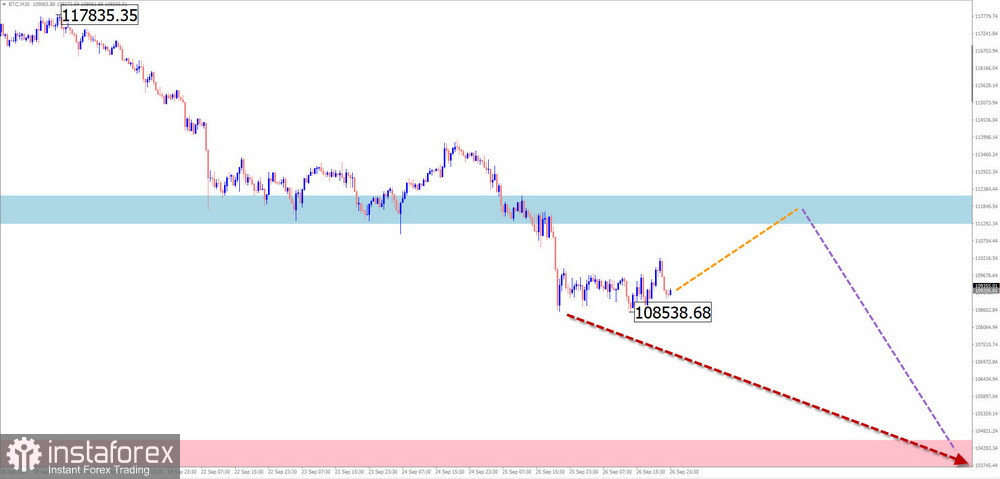
Since March, Bitcoin's trend has been guided by an upward wave. For the past three months, prices have been forming the corrective part (B), which is still unfinished. The final segment is missing in the current structure.
Forecast:
This week, a continuation of Bitcoin's decline is expected until support is reached. In the early days, sideways movement with a pullback toward resistance is possible. Active decline is more likely in the second half. The support zone limits the downward range.
Potential reversal zones
Resistance:
Support:
Recommendations
Notes: In simplified wave analysis (SWA), all waves consist of three parts (A-B-C). On each timeframe, only the last unfinished wave is analyzed. Expected movements are shown with dotted lines.
Attention: The wave algorithm does not account for the duration of price moves in time!


