See also

 04.11.2025 10:10 AM
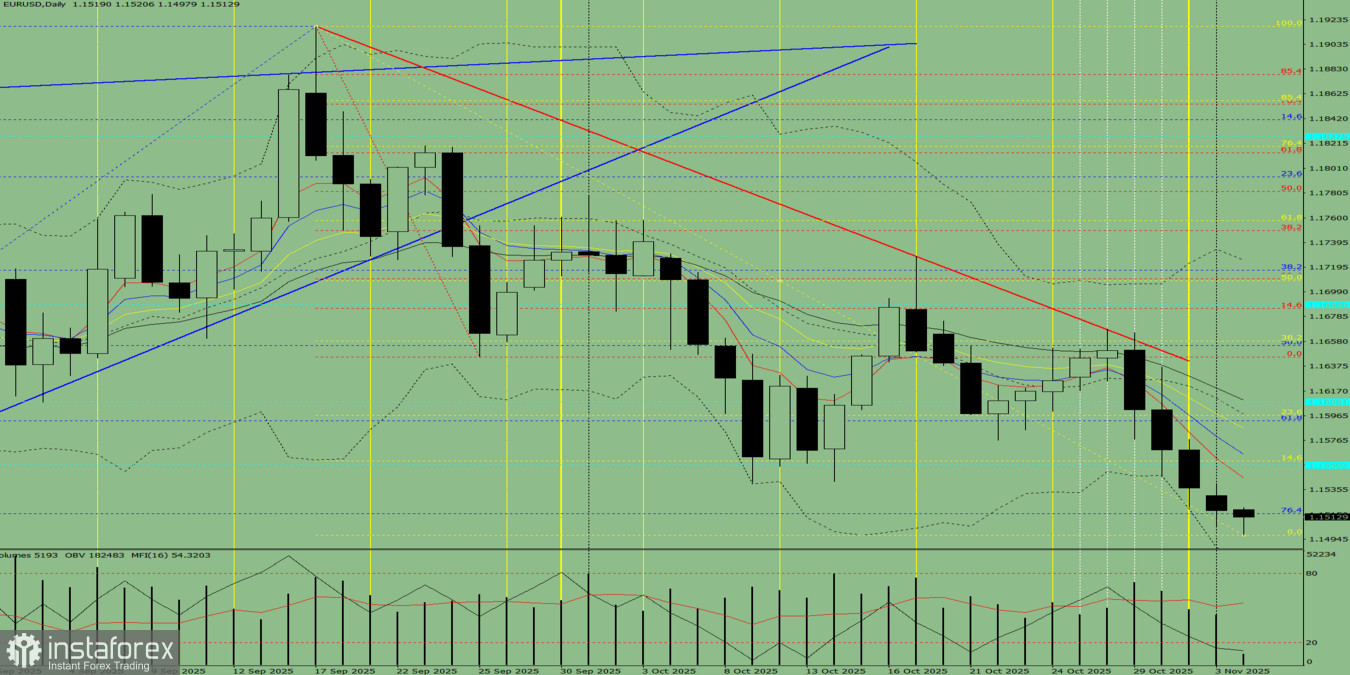
Fig. 1 (Daily Chart).
Comprehensive Analysis:
Overall conclusion: Upward trend.
Alternative scenario: From the level of 1.1518 (the close of yesterday's daily candle), the price may begin moving upward toward the target of 1.1545 — the 5-period EMA (thin red line). Upon testing this line, the price may possibly pull back downward toward 1.1515 — the 76.4% retracement level (blue dashed line).
You have already liked this post today
*The market analysis posted here is meant to increase your awareness, but not to give instructions to make a trade.


