See also

 05.11.2025 11:58 AM
On Wednesday, from the 1.3017 level (yesterday's daily close), the market may begin moving upward toward 1.3057, the 185.4% target level (red dotted line). Upon testing this level, the price may then pull back downward toward 1.3043, the historical support level (blue dotted line).
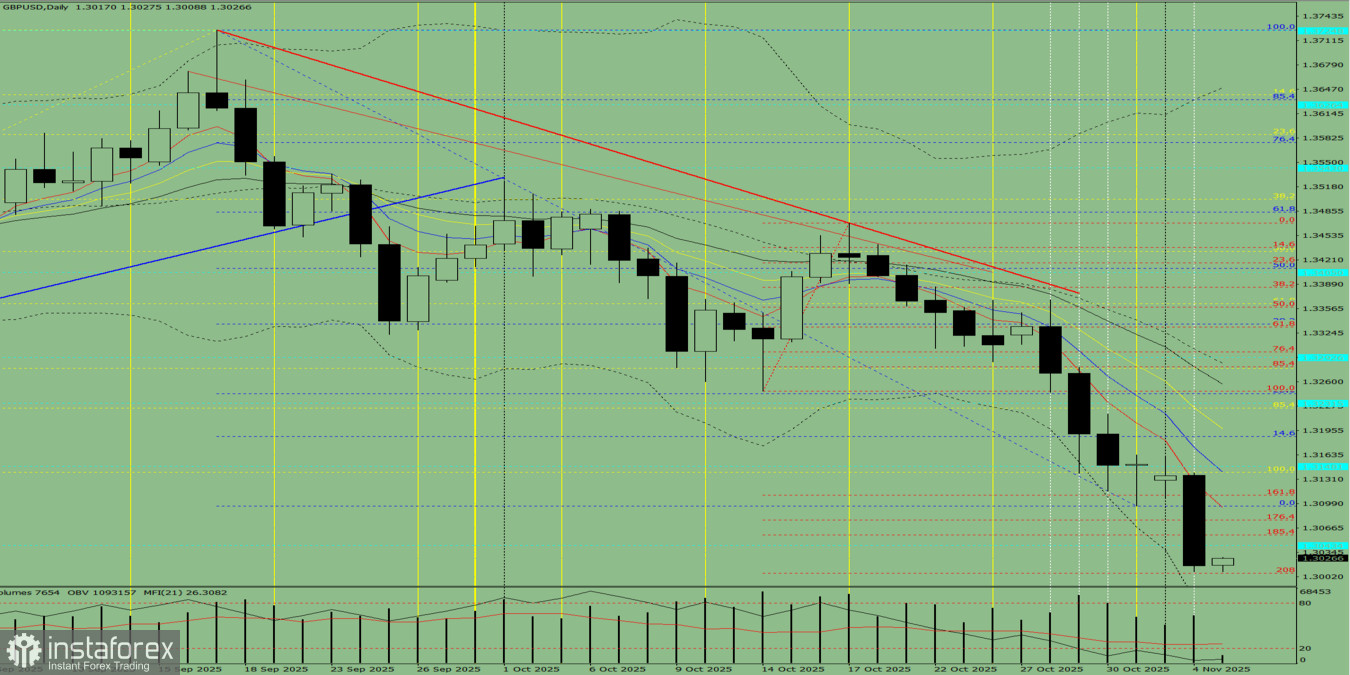
Fig. 1 (Daily Chart)
Overall conclusion: upward trend.
Alternative scenario: On Wednesday, from the 1.3017 level (yesterday's daily close), the market may begin moving upward toward 1.3043, the historical support level (blue dotted line). Upon testing this level, the price may then pull back downward toward 1.3006, the 208% target level (red dotted line).
You have already liked this post today
*The market analysis posted here is meant to increase your awareness, but not to give instructions to make a trade.


