See also

 10.11.2025 04:33 AM
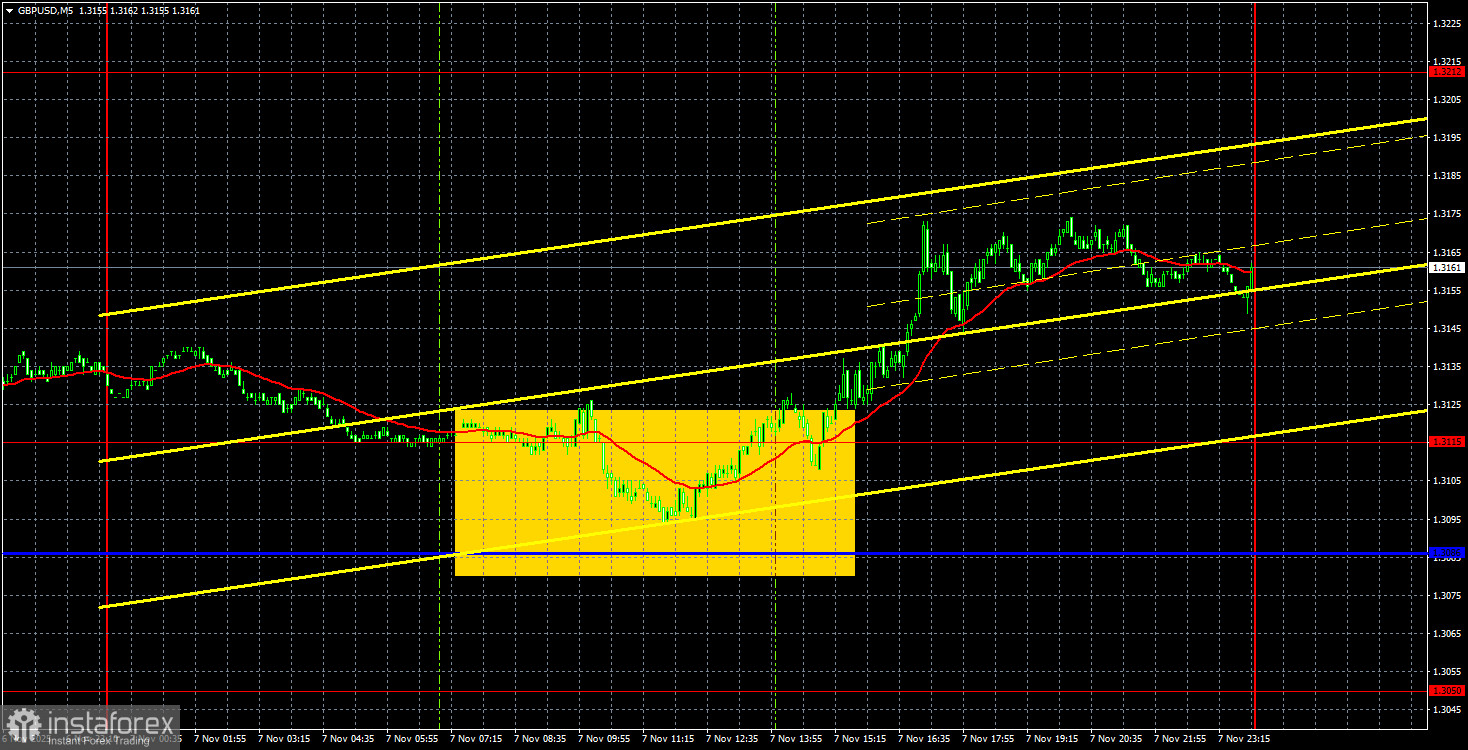
The GBP/USD currency pair continued its upward movement for almost the entire day on Friday, with no significant local factors driving it. It should be noted that for the past month and a half, the British currency has only been falling, which completely contradicts, at least, the global fundamental background. However, a flat trend has developed on the daily timeframe for both the euro and the pound sterling. Thus, from a technical perspective, the pound's one-and-a-half-month decline can be explained. The GBP/USD pair has now even gone below the lower line of the sideways channel on the daily chart, but it is important to remember that this is not a definitive sign of the end of the flat. Those familiar with our cryptocurrency articles will recognize the concept of "deviation." Even if the flat is ending, any downward movement now constitutes a correction.
This correction may be nearing its end, and the fundamental background continues to support the U.S. dollar. Therefore, any rise in the pair at any time is justified. The British pound now needs to overcome the trend line and the Senkou Span B line for the trend to change definitively to an upward one. After that, we can expect growth towards levels of 1.3260, 1.3430, and 1.3700. On Friday, the only U.S. macroeconomic report on consumer sentiment turned out to be weak, but the market's reaction was only 20 pips.
On the 5-minute timeframe, one not-so-obvious buy signal was formed on Friday. The price bounced off the area of 1.3086 (Kijun-sen) to 1.3115, then moved 30 pips higher. We believe this movement may continue this week, with obvious targets above at 1.3190 and 1.3212.
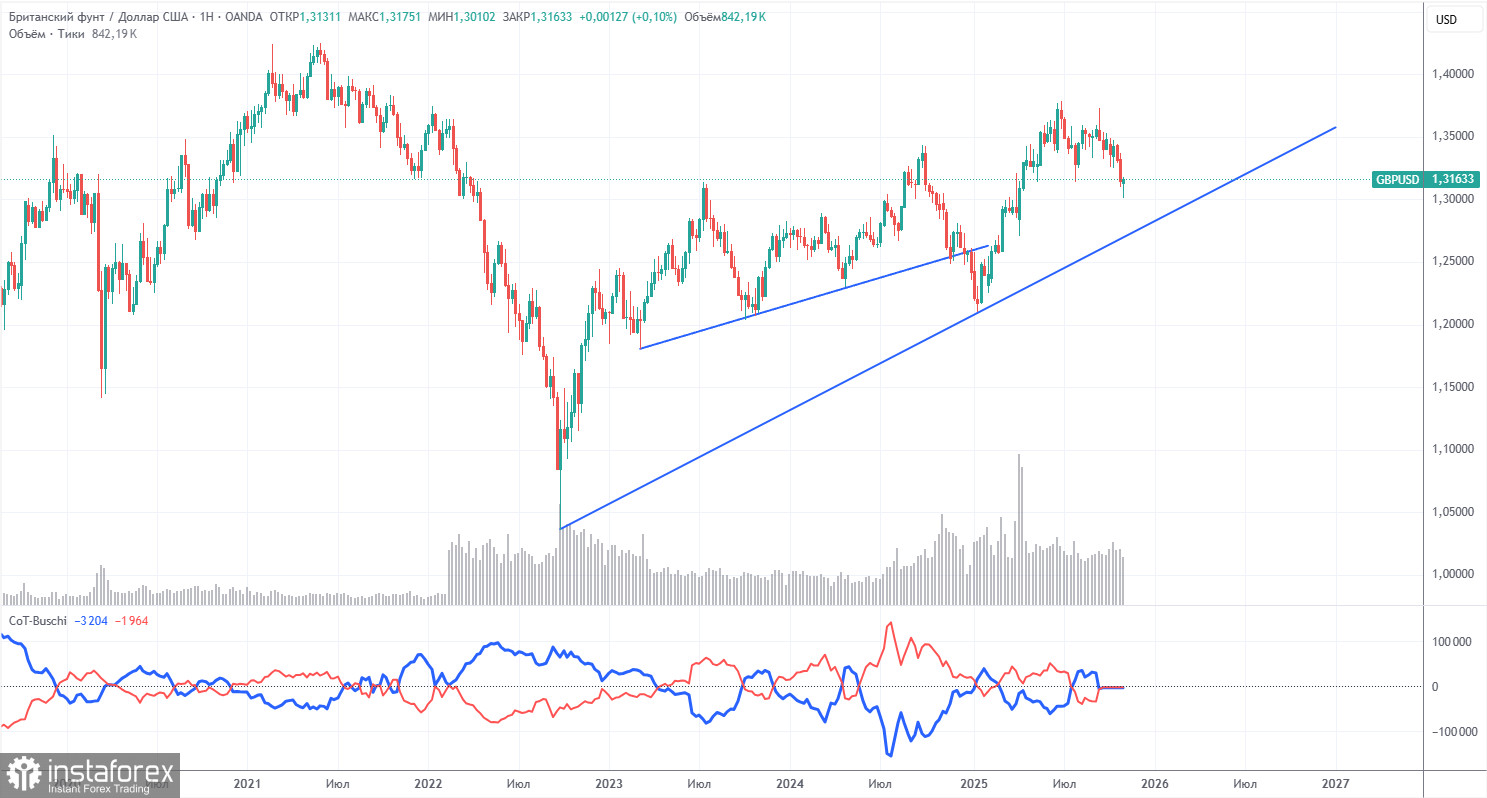
COT reports for the British pound show that commercial traders' sentiment has been changing constantly in recent years. The red and blue lines representing the net positions of commercial and non-commercial traders frequently cross each other and are mostly near the zero mark. Currently, they are at almost the same level, indicating approximately equal amounts of long and short positions.
The dollar continues to decline due to Donald Trump's policies, so market makers' demand for sterling is not particularly significant at the moment. The trade war will continue in one form or another for a long time. The Fed will, in any case, lower rates in the coming year, leading to a decline in dollar demand in one way or another. According to the latest report (dated September 23) on the British pound, the "Non-commercial" group opened 3,700 BUY contracts and closed 900 SELL contracts. Thus, the net position of non-commercial traders increased by 4,600 contracts over the week. However, this data is already outdated, and there are no new reports.
In 2025, the pound rose significantly, but one must understand that this was due to Donald Trump's policies. Once this reason is mitigated, the dollar may begin to rise, but when this will happen is anyone's guess. It does not matter how fast the net position for the pound is increasing or decreasing. The net position for the dollar is declining in any case, and it is generally declining faster.
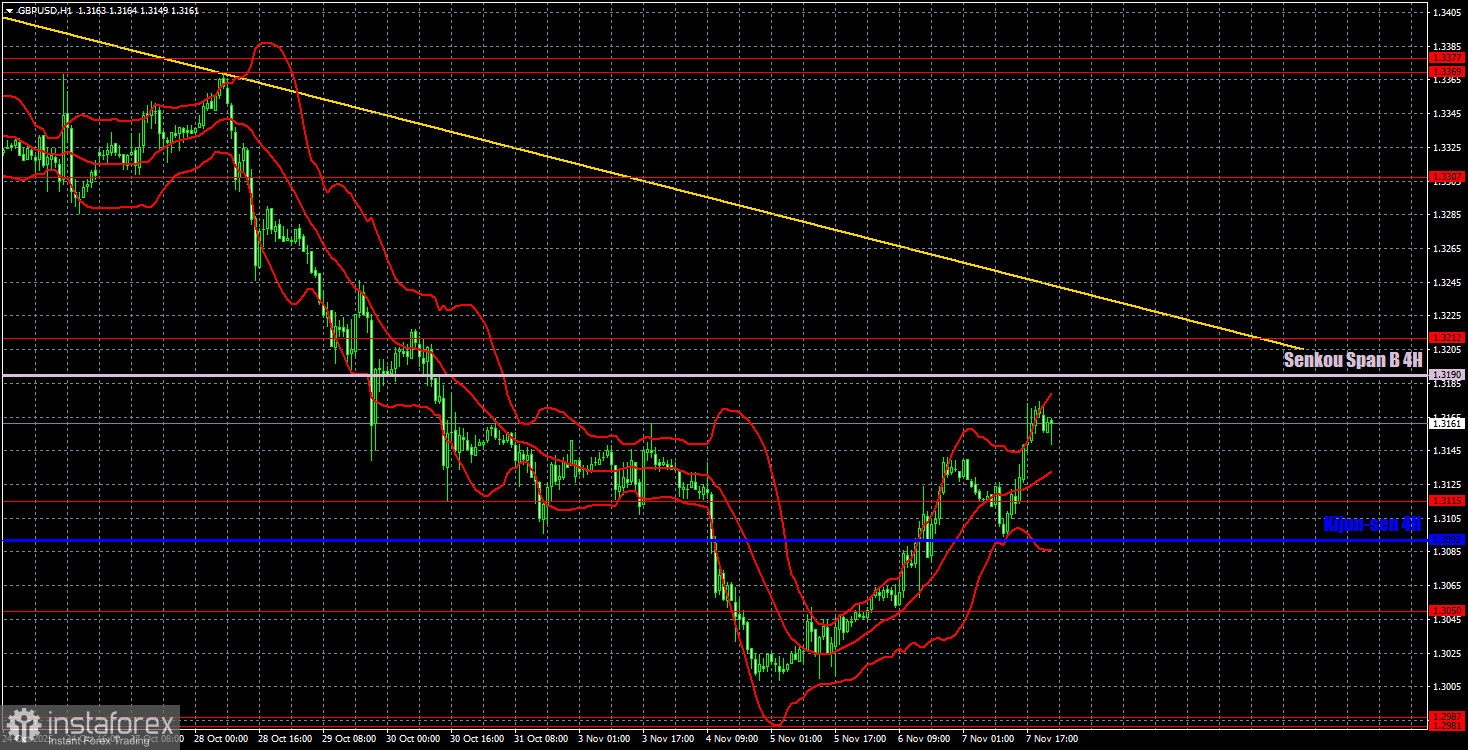
On the hourly timeframe, the GBP/USD pair continues to form a downward trend. The dollar still lacks global reasons to strengthen, so we expect the pair to rise towards the 2025 highs in almost any case. Last week, the price broke above the Kijun-sen line, and this week it may attempt to surpass the trend line and the Senkou Span B line. If the attempt is successful, the trend will change to an upward one. We believe that growth will continue regardless of the macroeconomic and fundamental background.
For November 10, we highlight the following important levels: 1.2863, 1.2981-1.2987, 1.3050, 1.3115, 1.3212, 1.3307, 1.3369-1.3377, 1.3420, 1.3533-1.3548, 1.3584. The lines of Senkou Span B (1.3190) and Kijun-sen (1.3092) may also serve as sources of signals. It is recommended to place the Stop Loss at breakeven after the price moves in the correct direction by 20 pips. The lines of the Ichimoku indicator may shift during the day, which should be considered when determining trading signals.
On Monday, there are no interesting events scheduled in the UK or the U.S. Most likely, the pair will continue its weak upward movement but will not break through its two resistance levels.


