See also

 10.11.2025 10:09 AM
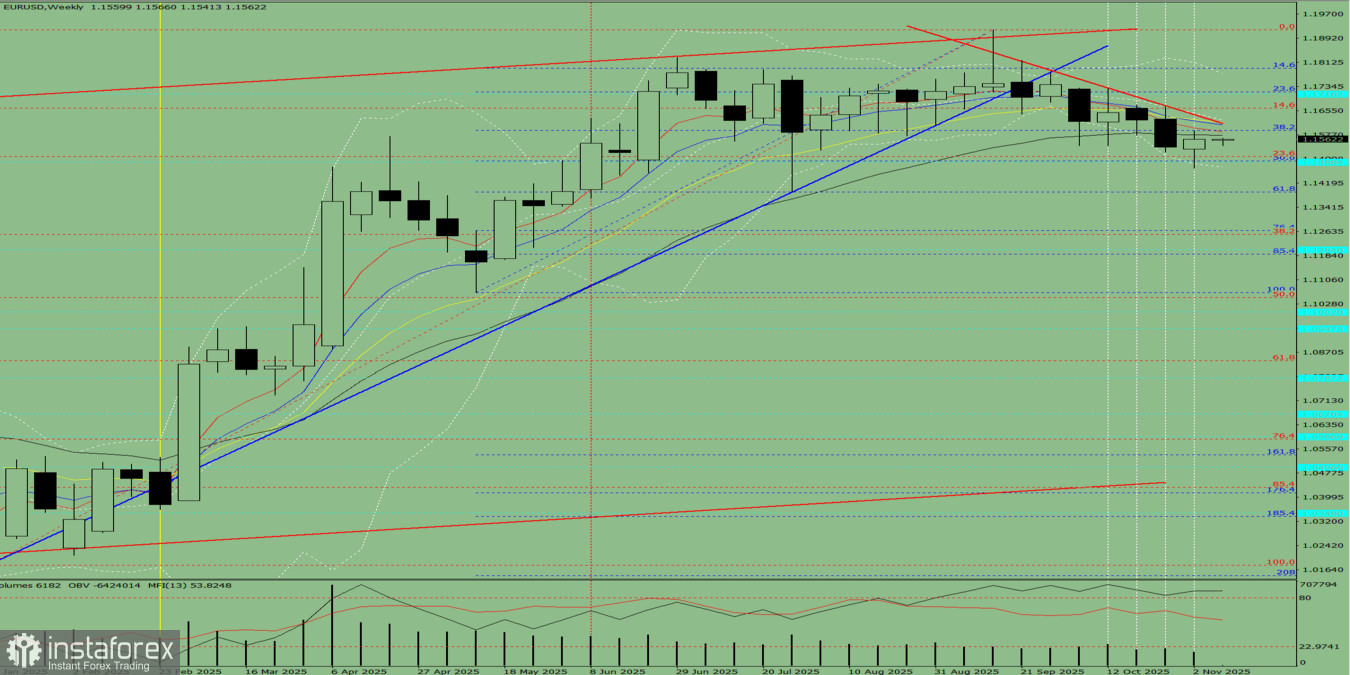
Fig. 1 (Weekly Chart)
Comprehensive Analysis:
Conclusion from the comprehensive analysis: Downward movement.
Overall Summary for the Weekly Candle of EUR/USD:
During the week, the price will most likely show a downward trend, with no upper shadow on the weekly black candle (Monday — downward movement) and the presence of a lower shadow (Friday — upward movement).
Alternative Scenario:
From the level of 1.1563 (the closing price of the last weekly candle), the pair may begin moving downward toward 1.1266 — the 76.4% retracement level (blue dotted line). Upon testing this level, the price may rebound upward toward 1.1391 — the 61.8% retracement level (blue dotted line).
You have already liked this post today
*The market analysis posted here is meant to increase your awareness, but not to give instructions to make a trade.


