See also

 14.01.2026 07:13 AM
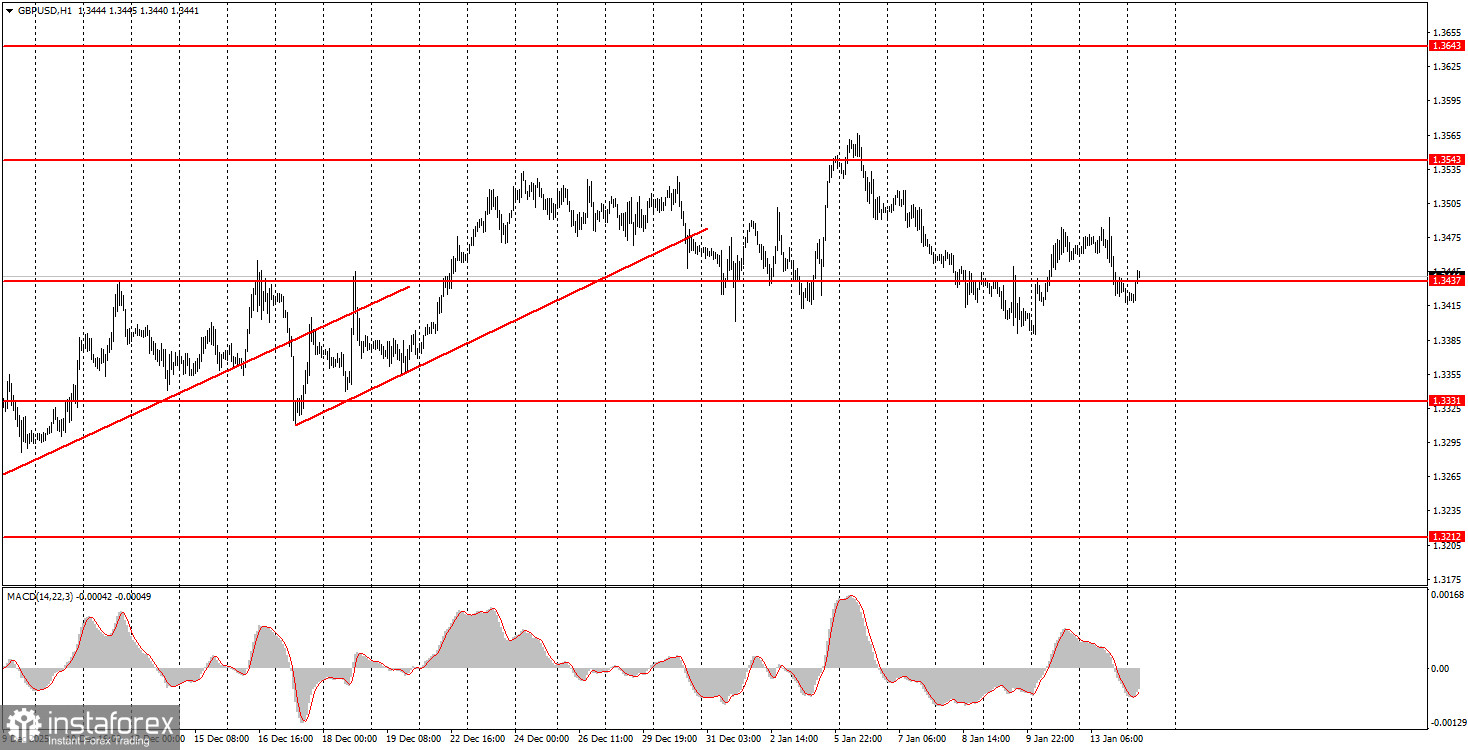
The GBP/USD pair declined slightly on Tuesday, which could have been triggered by the US inflation report. But overall, the GBP/USD pair has been moving sideways for several weeks, as shown on the hourly TF. The inflation report showed no change for December — the CPI remained at 2.7%. What does this number mean? Essentially, nothing. If inflation had risen, the probability of a new Fed rate cut would have decreased. If inflation had continued to slow, the Fed could have resumed monetary easing quickly. In the first case, one could expect dollar strength; in the second, weakness. But what growth or fall can we talk about if the price has been trading sideways for three weeks and average daily volatility is 68 pips? There is currently no technical tendency up or down. The market practically does not react to fundamental events.
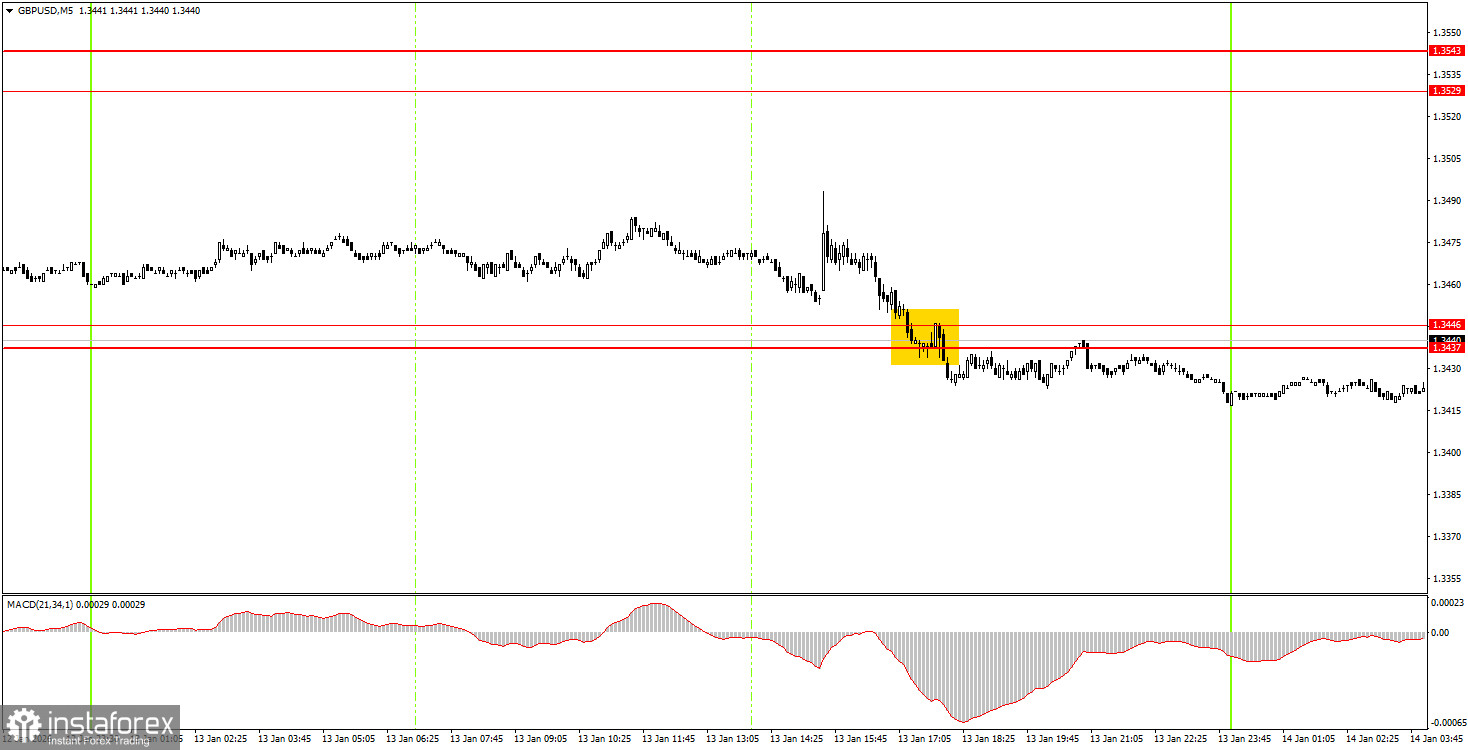
On the 5-minute TF on Tuesday, one sell trading signal was formed. The price settled below the 1.3437–1.3446 area during the US session. As soon as it settled, the downward movement stopped. Today, the price may bounce off that area from below, which would suggest a new decline — naturally, a weak one.
On the hourly TF, the GBP/USD pair settled below the trendline; we see that there is no clear downtrend at the moment. Rather, another flat. There are no global reasons for medium-term dollar strength, so we expect movement only to the north. Overall, we also expect a resumption of the 2025 global uptrend, which could bring the pair to 1.4000 within the next couple of months.
On Wednesday, novice traders may consider new short positions targeting the 1.3319–1.3331 area if the price bounces off the 1.3437–1.3446 area. A close above the 1.3437–1.3446 area would make longs relevant with a target of 1.3529–1.3543.
On the 5-minute TF, you can trade using the levels 1.3043, 1.3096–1.3107, 1.3203–1.3212, 1.3259–1.3267, 1.3319–1.3331, 1.3437–1.3446, 1.3529–1.3543, 1.3574–1.3590, 1.3643–1.3652, 1.3682, 1.3763. No important data or events are scheduled in the UK for Wednesday, but the US will publish retail sales and PPI reports, which could at least slightly move the price.
Support and resistance price levels — levels that serve as targets when opening buys or sells. Take Profit can be placed near them.
Red lines — channels or trendlines that reflect the current tendency and show which direction is preferable to trade now.
MACD indicator (14,22,3) — histogram and signal line — an auxiliary indicator that can also be used as a source of signals.
Important speeches and reports (always listed in the news calendar) can strongly affect a currency pair's movement. Therefore, during their release, trading should be done with maximum caution, or positions should be closed, to avoid a sharp price reversal against the preceding move.
Beginner forex traders should remember that not every trade can be profitable. Developing a clear strategy and effective money management are the keys to long-term trading success.


