
See also


 02.09.2026 01:32 PM
Analysis of Trades and Trading Advice for the Japanese Yen
The test of the 159.53 price level occurred when the MACD indicator had already moved significantly downward from the zero line, which limited the pair's downward potential. The second test of 159.53 triggered the implementation of Scenario No. 2 for buying the dollar, resulting in a rise of more than 30 points.
The market reacted to Ueda's statements and then returned to its previous trajectory. Ahead of us are the August ADP employment report, changes in factory orders, and the release of the Fed's Beige Book. The ADP report provides an early indication of labor market conditions, and its deviation from forecasts will determine the dollar's direction through expectations for interest rates and US Treasury yields. Factory orders and the regional economic assessment will provide additional information on the state of the economy. For the yen, the outcome of the labor market report is directly relevant, as the currency is particularly sensitive to Fed policy. Strong data could push USD/JPY higher. However, it is also important to keep in mind the intervention factor and the plans for interest rate hikes discussed today by the Governor of the Bank of Japan.
As for the intraday strategy, I will focus more on the implementation of Scenarios No. 1 and No. 2.
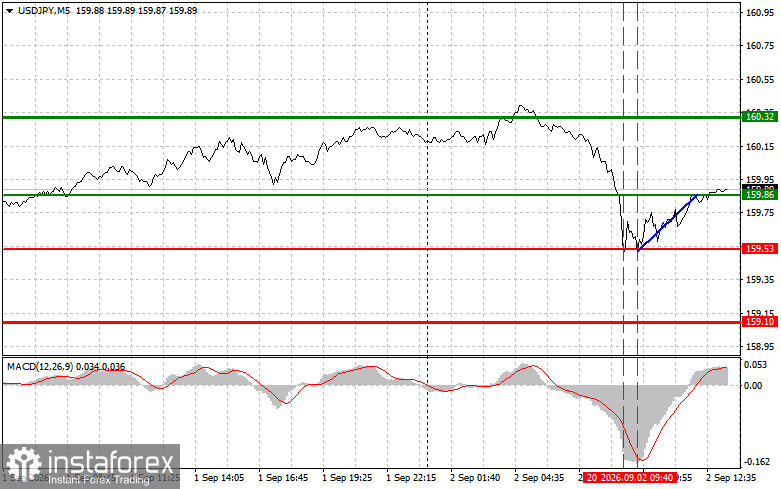
Buy Signal
Scenario No. 1: Today, I plan to buy USD/JPY when the entry point is reached around 160.00 (the green line on the chart), with a target of rising to the 160.35 level (the thicker green line on the chart). Around 160.35, I will exit the long position and open a short position in the opposite direction, targeting a move of 30–35 points in the opposite direction from the level. A rise in the pair today can be expected, but the upward potential is rather limited. Important! Before buying, make sure that the MACD indicator is above the zero line and has only just started rising from it.
Scenario No. 2: I also plan to buy USD/JPY today if the price tests the 159.79 level twice consecutively while the MACD indicator is in the oversold area. This will limit the pair's downward potential and lead to a reversal of the market to the upside. A rise toward the opposite levels of 160.00 and 160.35 can be expected.
Sell Signal
Scenario No. 1: Today, I plan to sell USD/JPY after the 159.79 level is breached (the red line on the chart), which will lead to a rapid decline in the pair. The key target for sellers will be the 159.55 level, where I will exit the short position and immediately open a long position in the opposite direction, targeting a move of 20–25 points in the opposite direction from the level. Pressure on the pair will return today if the central bank intervenes. Important! Before selling, make sure that the MACD indicator is below the zero line and has only just started declining from it.
Scenario No. 2: I also plan to sell USD/JPY today if the price tests the 160.00 level twice consecutively while the MACD indicator is in the overbought area. This will limit the pair's upward potential and lead to a reversal of the market to the downside. A decline toward the opposite levels of 159.79 and 159.55 can be expected.
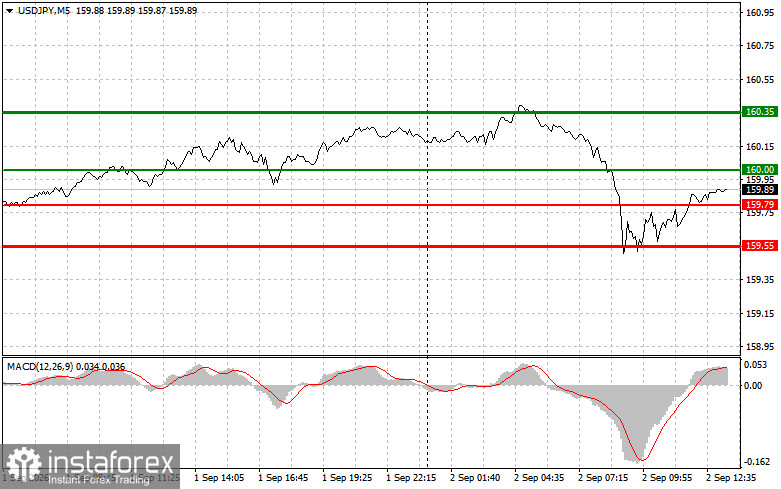
What Is Shown on the Chart:
Important. Beginner Forex traders need to be very cautious when making market entry decisions. Before the release of important fundamental reports, it is best to stay out of the market to avoid exposure to sharp exchange-rate fluctuations. If you decide to trade during the release of news, always place stop orders to minimize losses. Without stop orders, you can lose your entire deposit very quickly, especially if you do not use proper money management and trade large volumes.
And remember that successful trading requires a clear trading plan, such as the one presented above. Making spontaneous trading decisions based on the current market situation is inherently a losing strategy for an intraday trader.


