Lihat juga

 08.05.2025 07:22 PM
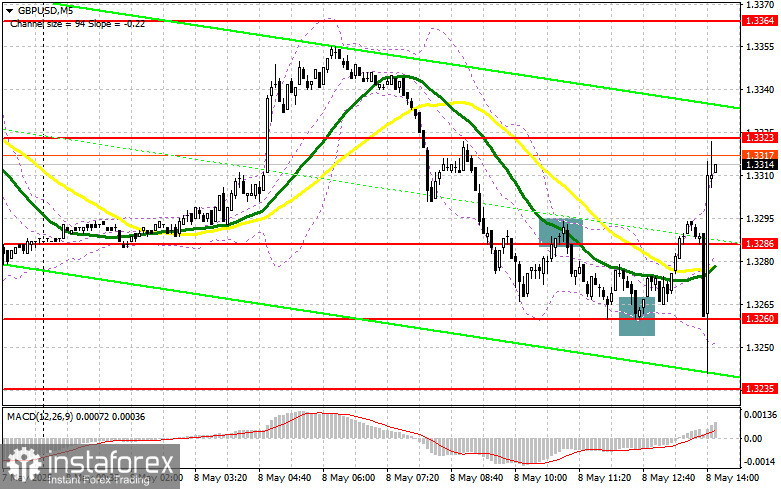
In my morning forecast, I focused on the 1.3286 level and planned to base market entries from it. Let's look at the 5-minute chart and analyze what happened. A breakout and retest of 1.3335 led to a short entry on the pound, resulting in a decline toward the support at 1.3260. A false breakout there provided a long entry point, pushing the pair back up to the 1.3323 level. The technical picture was revised for the second half of the day.
To open long positions on GBP/USD:
The Bank of England, as expected, cut interest rates. But traders seemed prepared for this, and only the policy summary and forward guidance will clarify the next direction for the pair. As for U.S. statistics, data on weekly jobless claims and nonfarm productivity are unlikely to significantly impact GBP/USD.
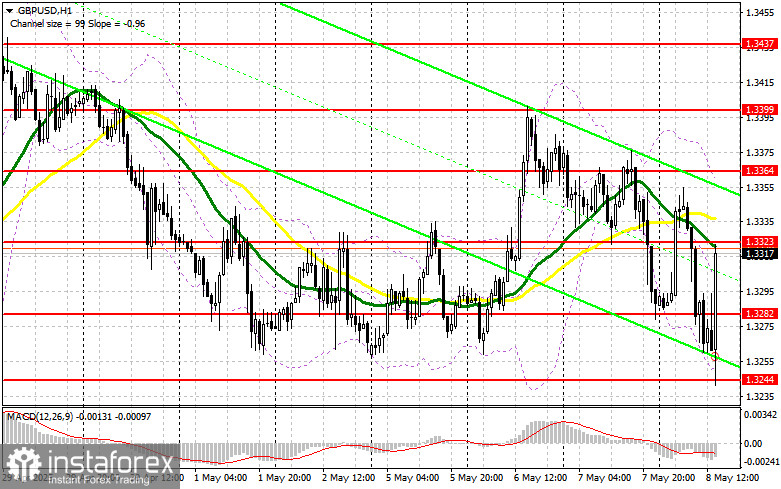
If the pair declines again, I prefer to act near the new support at 1.3282, formed earlier today. A false breakout there will offer a good entry point for long positions with the target of recovery toward the 1.3323 resistance, which is currently being contested. A breakout and retest of this area from above will signal a new long entry with a target of 1.3364, restoring bullish market potential. The furthest target will be 1.3399, where I plan to take profit.
If GBP/USD declines and buyers show no activity at 1.3282 in the second half of the day, pressure on the pound will return. In that case, only a false breakout around 1.3244 would provide a suitable opportunity to go long. I'll consider buying on a direct rebound from 1.3205, aiming for an intraday correction of 30–35 points.
To open short positions on GBP/USD:
Sellers showed strength but were met with an unclear reaction to the Bank of England's rate cut, so the situation remains paused. If GBP/USD rises again after weak U.S. data, I'll only act on a false breakout near 1.3323. This will offer a short entry with a target at 1.3282. A breakout and retest of this range from below will clear stop orders and open a path toward 1.3244. The ultimate target will be 1.3205, where I plan to take profit.
If demand for the pound remains high and bears don't appear near 1.3323—where moving averages now align in their favor—then selling should be postponed until a test of the 1.3364 resistance. I'll only open shorts there on a false breakout. If there's no bearish signal even there, I'll consider shorts from 1.3399 on a rebound, targeting a 30–35-point correction.
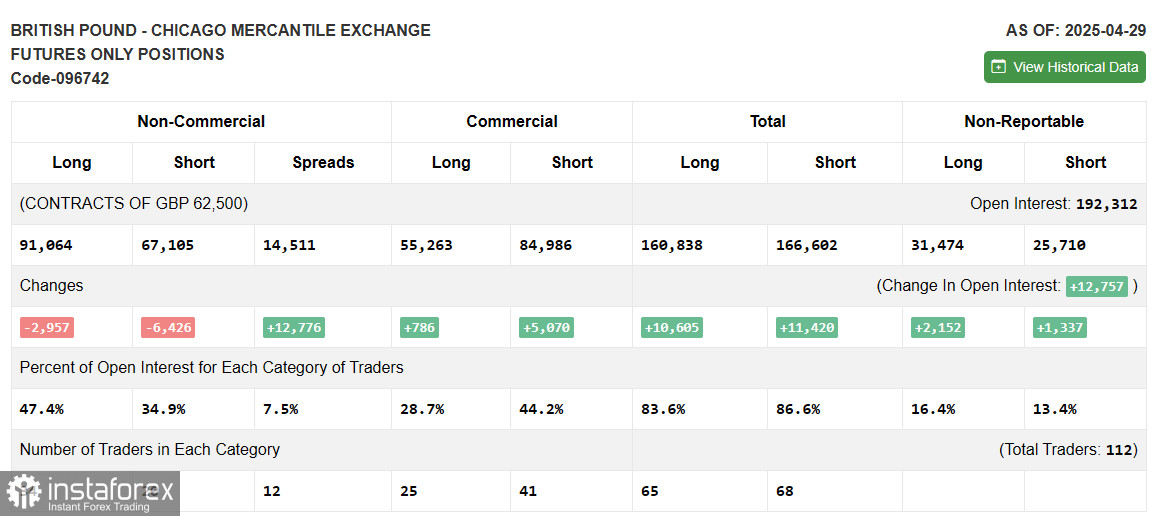
COT Report (Commitment of Traders) for April 29:
The latest COT report showed a decrease in both long and short positions. Given that neither the Bank of England nor the U.S. Federal Reserve plans to lower interest rates further for now, traders will likely focus on new macroeconomic data that could shed light on the health of the UK economy and the impact of Trump's trade tariffs. According to the COT report, long non-commercial positions fell by 2,957 to 91,064, while short positions dropped by 6,426 to 67,105. This expanded the gap between longs and shorts by 12,776 in favor of the bulls.
Indicator Signals:
Moving Averages: Trading is below the 30- and 50-period moving averages, signaling potential further pound weakness.
Note: The moving average periods and prices used by the author are based on the H1 chart and may differ from classical D1 definitions.
Bollinger Bands: In case of a decline, the lower boundary of the indicator around 1.3250 will act as support.
Indicator Descriptions:


