Lihat juga

 09.06.2025 03:33 AM
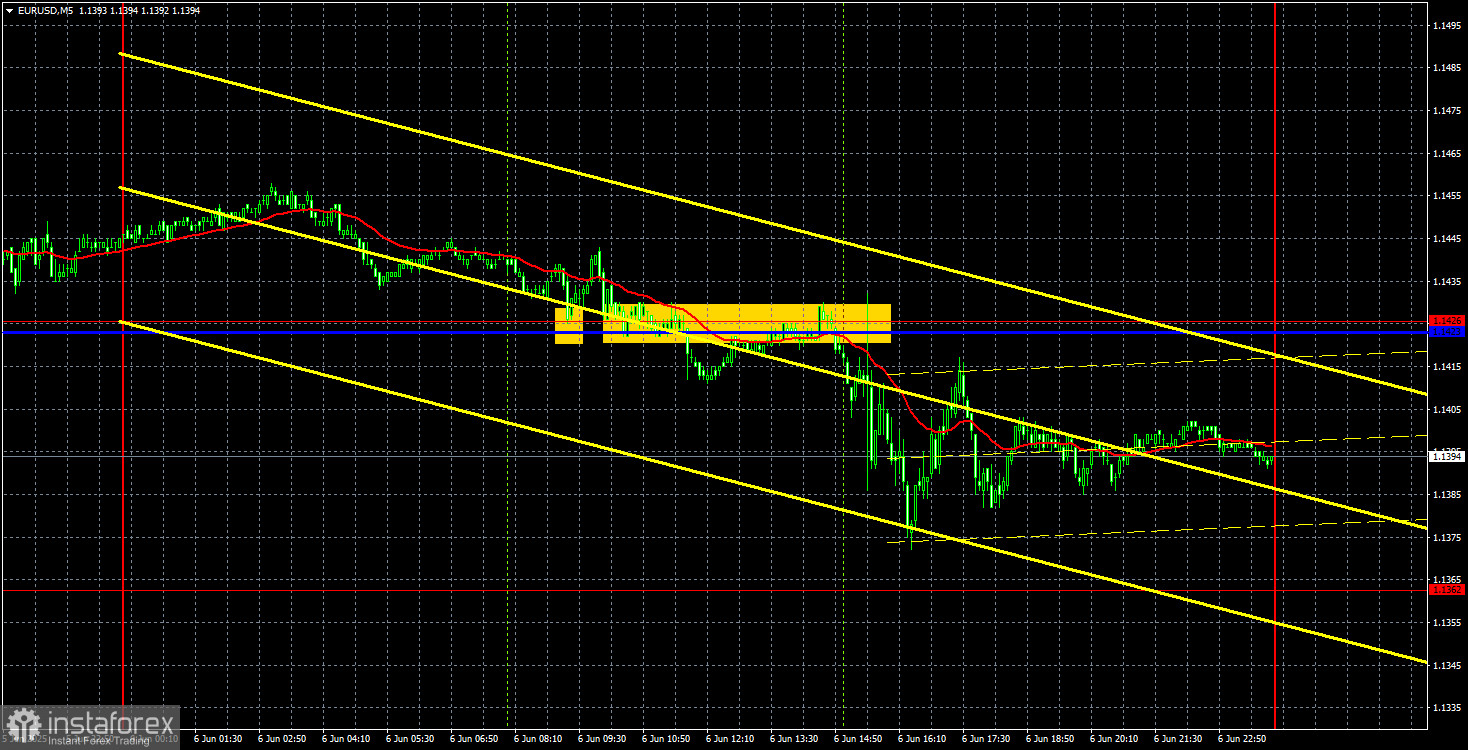
On Friday, the EUR/USD currency pair continued its relatively mild decline and ended the day near the familiar ascending trendline. Recall that about 10 days ago, this line was broken, signaling the end of the uptrend. However, the fundamental background related to Donald Trump's trade conflicts with the rest of the world again exerted intense pressure on the U.S. dollar, and the pair resumed its growth. We might be facing something similar again. On Friday, the macroeconomic background did support the sellers since the NonFarm Payrolls and unemployment rate reports couldn't exactly be called "strong," but neither were they disastrous. Instead, they showed average values that aligned with what traders had expected. However, under the current circumstances, where the U.S. economy may be slowing due to Trump's tariffs, one could have expected even worse labor market figures.
How long will the dollar rise this time if a new scandal with entirely unpredictable consequences is brewing in the U.S.? We want to highlight that even a break below the trendline doesn't guarantee that Trump won't impose new tariffs tomorrow or that a new round of the Trump-Musk war won't start, which could trigger another wave of dollar sell-offs.
Several signals were formed in the 5-minute timeframe on Friday, but the movements were chaotic. Initially, the pair rebounded from the 1.1423–1.1426 area but failed to develop an upward movement. The signal turned out to be false. Then, the pair broke through this area and rebounded from below several times, so the sell signal was valid, but during the American session, important reports were released that caused erratic swings. It was dangerous to trade, but short positions ended up being profitable. However, there was no strong downward movement.
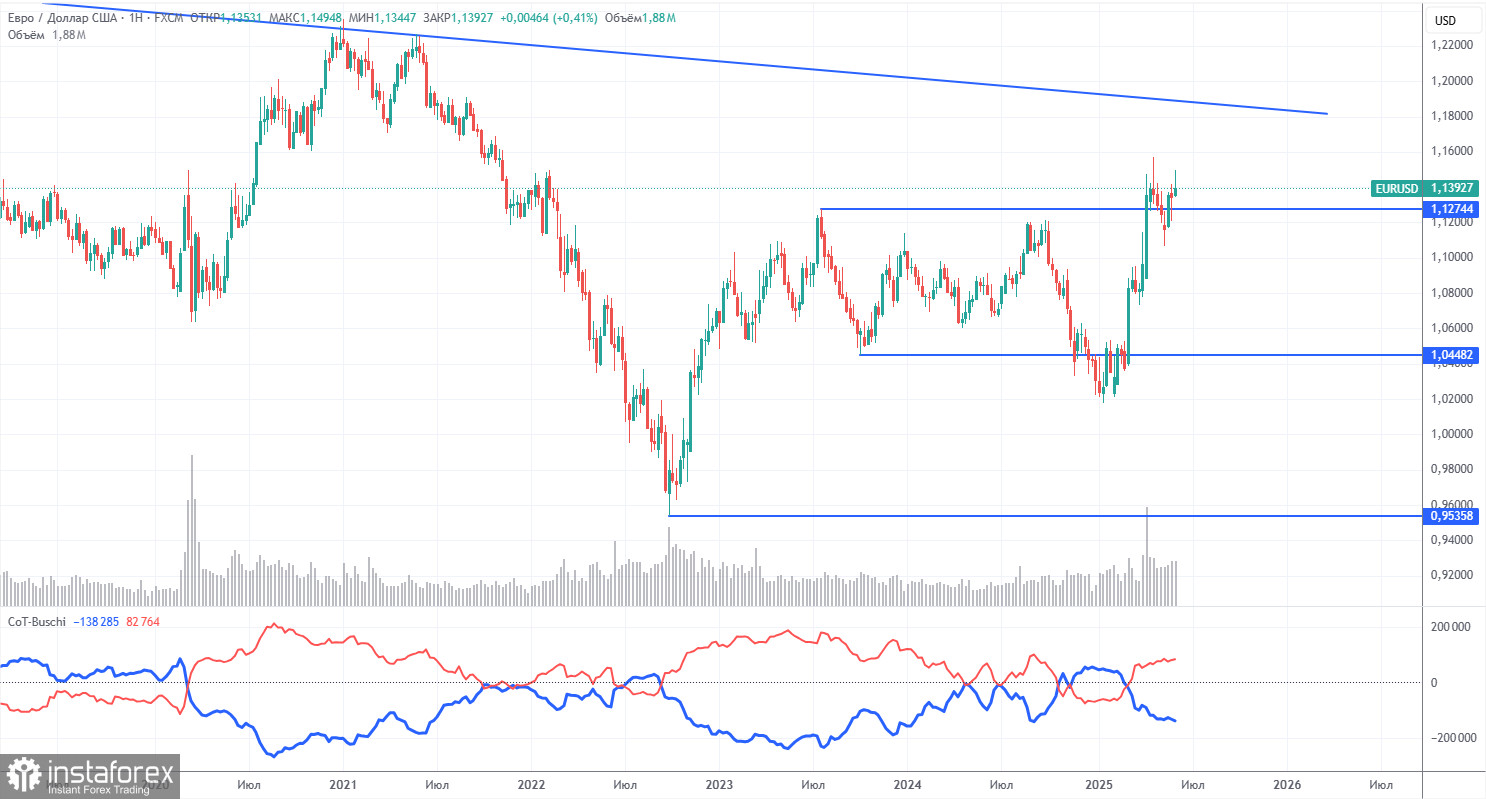
The latest COT report is dated June 3. The chart above shows that the net position of non-commercial traders had long been "bullish," and the bears barely managed to gain the upper hand at the end of 2024 but quickly lost it. Since Trump took office, only the dollar has been falling. We cannot confidently say that the dollar's decline will persist, but current global developments indicate this possibility.
We still see no fundamental factors for strengthening the euro, but one very significant factor is the decline of the dollar. The global downward trend persists, but what does the trend even matter now? Once Trump ends his trade wars, the dollar might start growing again — but will he end them, and when?
The red and blue lines have crossed again, meaning the market returns to a "bullish" trend. Over the last reporting week, the number of longs among the "Non-commercial" group decreased by 1,500, while shorts dropped by 4,800. As a result, the net position increased by 3,300.
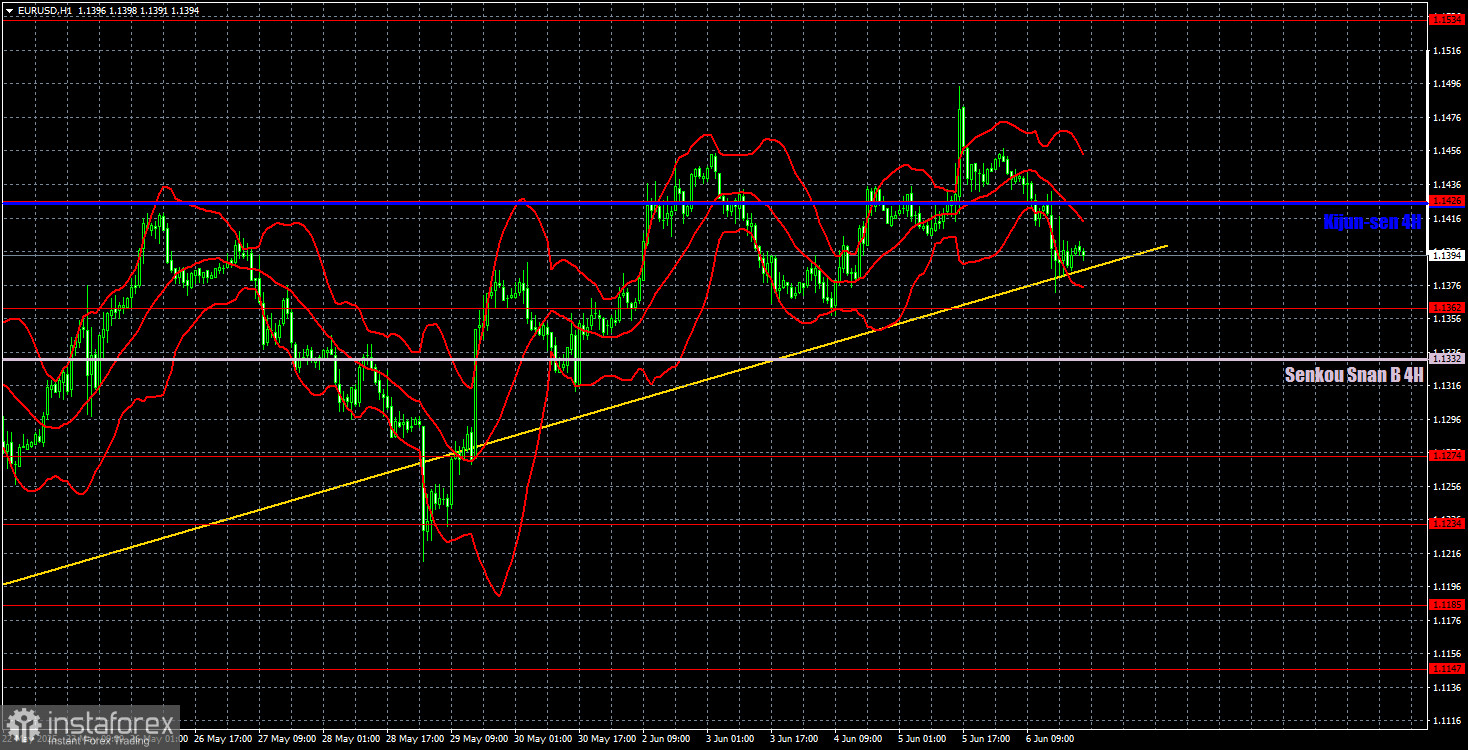
In the hourly timeframe, the EUR/USD pair maintains its local uptrend, which is part of a four-month trend. The outlook for the U.S. dollar still heavily depends on developments related to the global trade war. At this moment, we can only say one thing: no peace agreements are in sight, and Trump continues to make strange decisions and statements, regularly shocking market participants. The market expects the worst, and Trump keeps confirming those fears. A new conflict with Elon Musk could seriously affect the American economy.
For June 9, we highlight the following trading levels: 1.0949, 1.1006, 1.1092, 1.1147, 1.1185, 1.1234, 1.1274, 1.1362, 1.1426, 1.1534, 1.1607, along with the Senkou Span B (1.1332) and Kijun-sen (1.1425) lines. The Ichimoku indicator lines may move during the day, which should be considered when determining trading signals. Remember to set the Stop Loss to breakeven if the price moves 15 pips in the right direction — this will protect against possible losses if the signal turns out to be false.
On Monday, no significant events or reports are scheduled in the Eurozone or the U.S., so the market may only react to news from Trump or Musk. While it's not guaranteed that such news will appear, monitoring news feeds closely is important to avoid missing sudden market moves.


