Lihat juga

 17.06.2025 08:49 PM
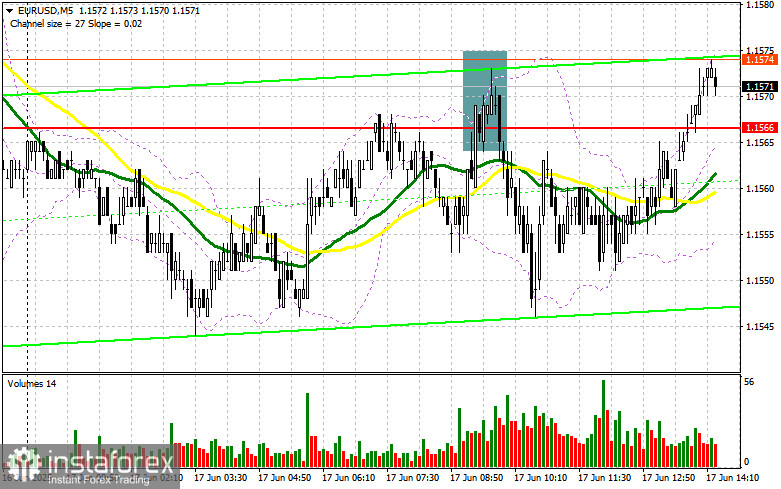
In my morning forecast, I highlighted the 1.1566 level and planned to make market entry decisions based on it. Let's look at the 5-minute chart to understand what happened. The rise and formation of a false breakout at that level offered a good entry point for euro selling, but a large downward move did not occur. After a 20-point drop, demand for the euro returned. The technical outlook for the second half of the day has been revised.
To Open Long Positions on EUR/USD:
Fairly decent data from the ZEW Business Sentiment Index for Germany and the eurozone—better than economists' forecasts—helped limit the pair's downward potential in the first half of the day. During the U.S. session, we expect some interesting reports: changes in retail sales, industrial production, and manufacturing output in the U.S., which could trigger EUR/USD volatility. However, only very weak data will allow the euro to continue rising.
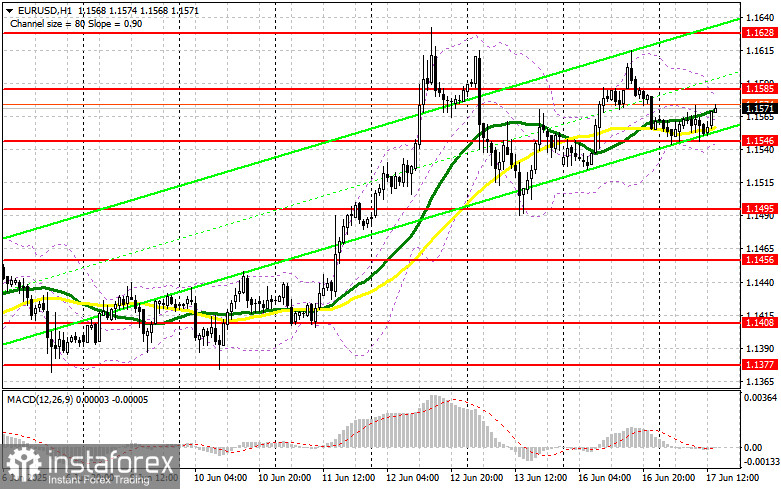
In case of a decline, I will act near the new support at 1.1456, formed earlier today. A false breakout at that level will be a signal to buy EUR/USD in anticipation of the continuation of the bullish trend and a retest of the resistance at 1.1585. A breakout and retest of this range will confirm a correct entry point with a target at the 1.1628 level—marking the monthly high. The ultimate target will be 1.1674, where I will take profits.
If EUR/USD falls and there is no activity near 1.1546, pressure on the pair will increase, possibly pushing it down to 1.1495. Only after a false breakout form at that level will I consider buying the euro. I also plan to open long positions on a rebound from 1.1456 with a target of 30–35 points intraday upward correction.
To Open Short Positions on EUR/USD:
Sellers showed activity in the first half of the day, but good eurozone data ruined the setup. Traders are now waiting for news on the Iran–Israel military conflict and thus refrain from active moves. A drop in EUR/USD can only be expected with very strong U.S. statistics.
If the pair rises again, only a false breakout around 1.1585 will be a signal to open short positions targeting 1.1546, where the moving averages are located. A breakout and consolidation below this range will be a good selling setup aiming for the 1.1495 level. The ultimate target will be 1.1456, where I will take profits.
If EUR/USD continues to rise in the second half of the day and bears remain inactive around 1.1585, buyers could push the pair even higher toward 1.1628. I will only sell there after a failed consolidation. I also plan to open short positions on a rebound from 1.1674, targeting a 30–35 point downward correction.
Commitments of Traders (COT) Report:
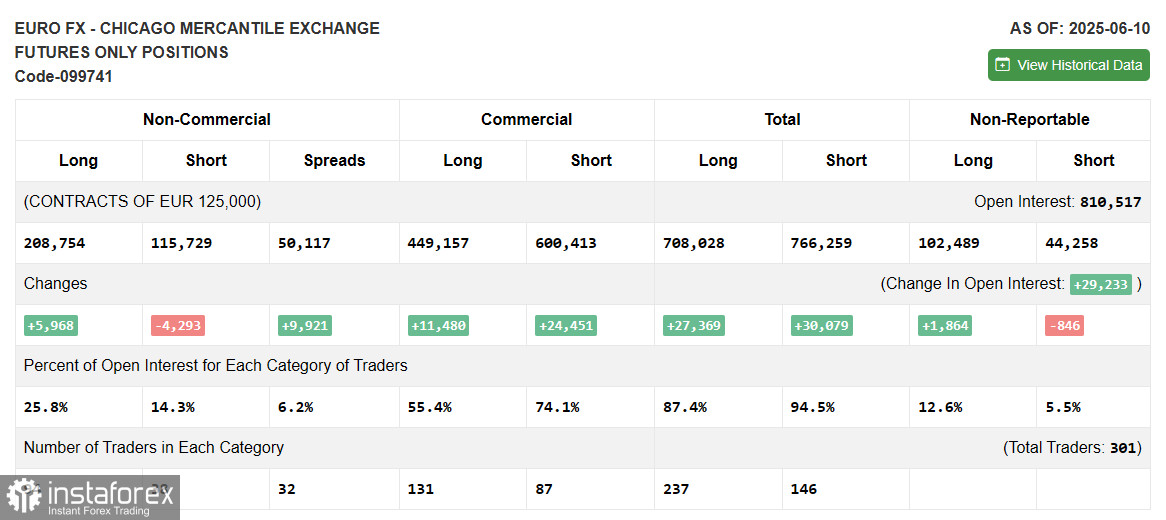
The June 10 COT report showed a reduction in short positions and an increase in longs. Despite data showing a sharp drop in U.S. inflation, the dollar found little support, even though the Fed is expected to keep rates unchanged for now.
More crucial will be how Jerome Powell comments on inflation and what forecasts he gives for potential rate cuts later this year. That will determine the next direction of EUR/USD, which so far continues its upward momentum, as the report confirms. Long non-commercial positions rose by 5,968 to 208,754, while short non-commercial positions fell by 4,293 to 115,729. This widened the long-to-short position gap by 9,921.
Indicator Signals:
Moving AveragesTrading is occurring around the 30- and 50-period moving averages, indicating a sideways market.
Note: The periods and prices of the moving averages are considered on the hourly chart (H1) and may differ from the classical daily moving averages on the D1 chart.
Bollinger Bands In case of a decline, the lower boundary of the indicator around 1.1545 will serve as support.
Indicator Descriptions:


