Lihat juga

 03.07.2025 12:10 PM
On Wednesday, the EUR/USD pair rebounded from the 1.1802 level, reversed in favor of the U.S. dollar, and showed a slight decline. However, by Thursday morning, the pair had returned to the 1.1802 level. Another rebound from this level would again favor the dollar and a further drop toward the 127.2% Fibonacci level at 1.1712. A firm close above 1.1802 would increase the likelihood of continued growth toward the 161.8% corrective level at 1.1888.
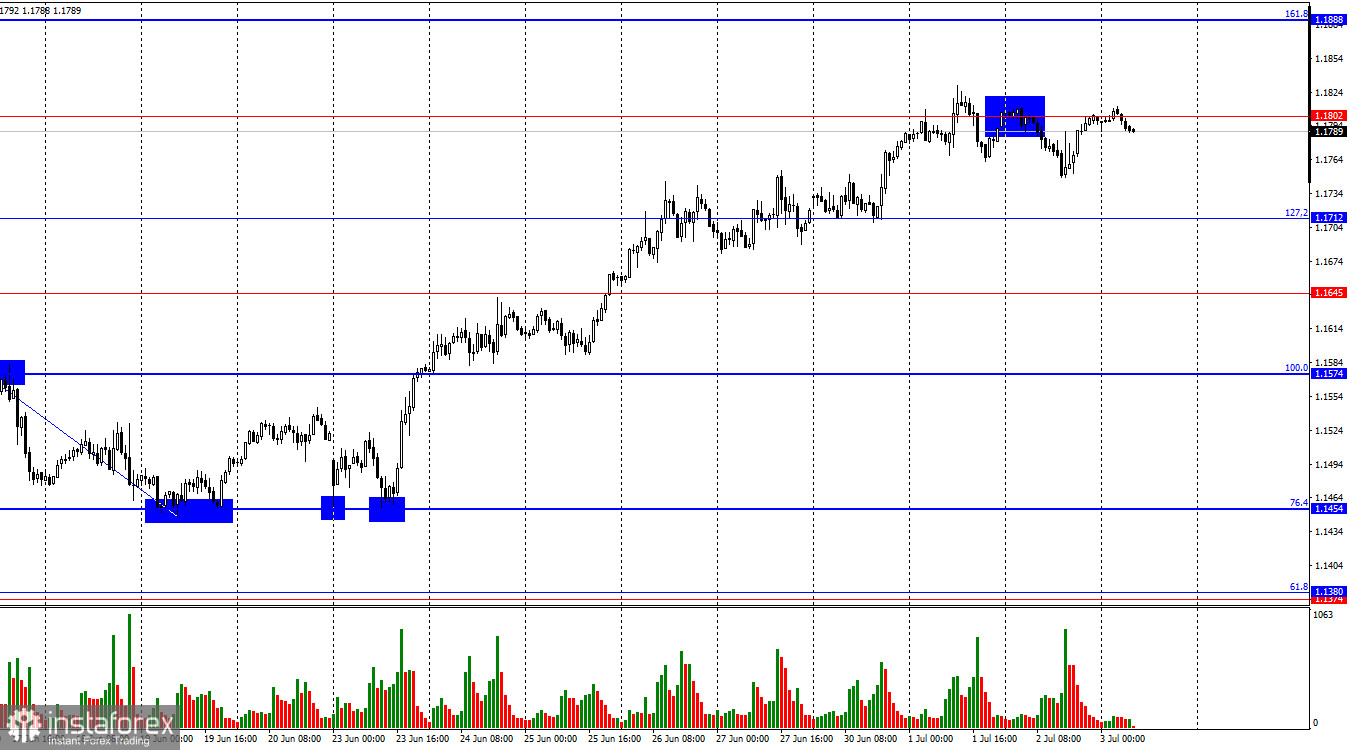
The wave structure on the hourly chart remains simple and clear. The last completed downward wave broke the low of the previous wave, and the new upward wave has surpassed the previous peak. Thus, the trend currently remains bullish. The lack of real progress in U.S.–China and U.S.–EU trade negotiations, the FOMC meeting that failed to support the dollar, and the conflict in the Middle East, which did not benefit the U.S. currency—all contributed to a short-lived and weak bearish trend, as expected.
Wednesday's news background was fairly light. There were few significant events or reports, so trader activity remained low. The only report that drew attention was the U.S. ADP employment data. The number of jobs in June fell by 33,000, while traders had expected an increase of 95,000. As a result, the dollar came under pressure in the second half of the day, and bears once again retreated, allowing the price to return to 1.1802. Today, the most important reports of the week are due—Nonfarm Payrolls, unemployment, and the ISM Services PMI. Since July 4 is a holiday in the U.S., all key releases have been brought forward to today. There have been no updates from Donald Trump, who aimed to secure new trade deals before Independence Day. On July 9, the U.S. president may raise tariffs again, potentially triggering another dollar selloff.
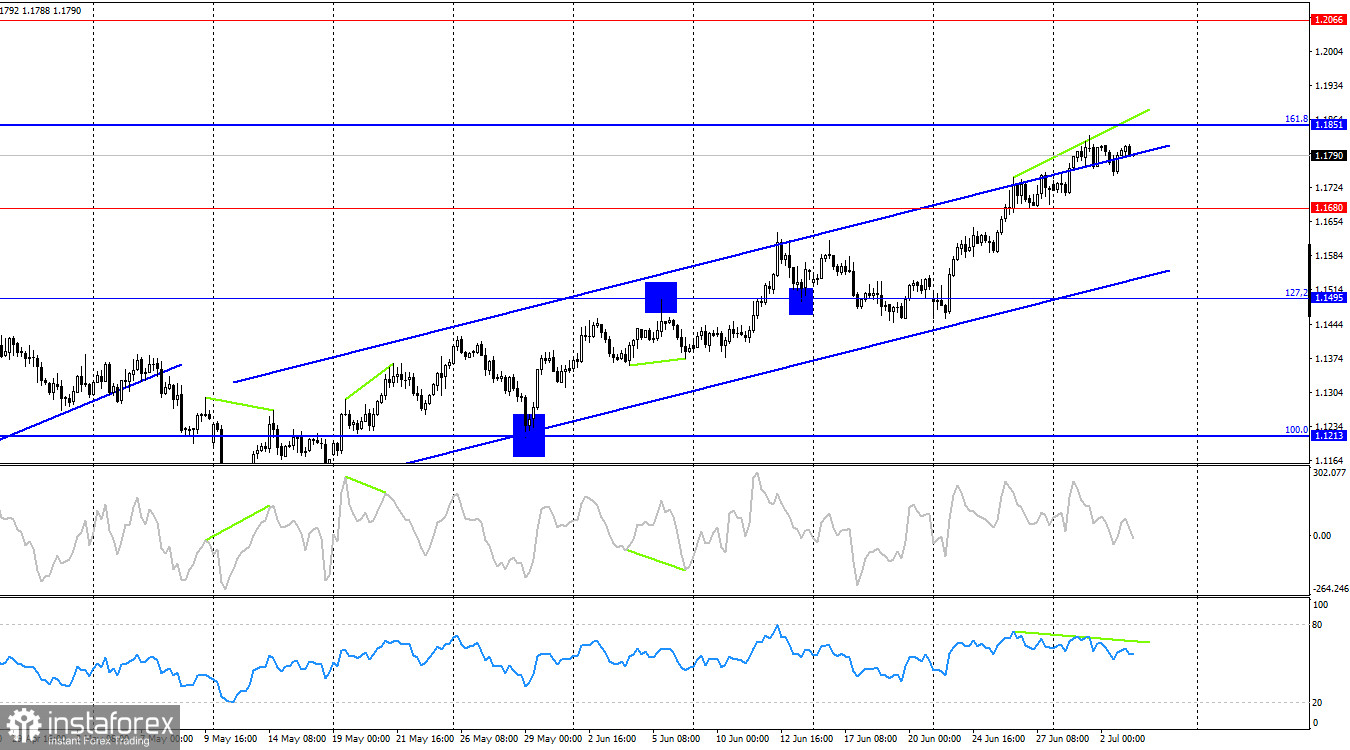
On the 4-hour chart, the pair has secured a position above 1.1680 and continues rising toward the next Fibonacci corrective level of 161.8% at 1.1851. A rebound from this level would favor the U.S. dollar and a modest decline within the current upward trend channel. A close above 1.1851 would increase the chances of further growth toward the next target at 1.2066. A bearish divergence is forming on the RSI indicator.
Commitments of Traders (COT) Report:
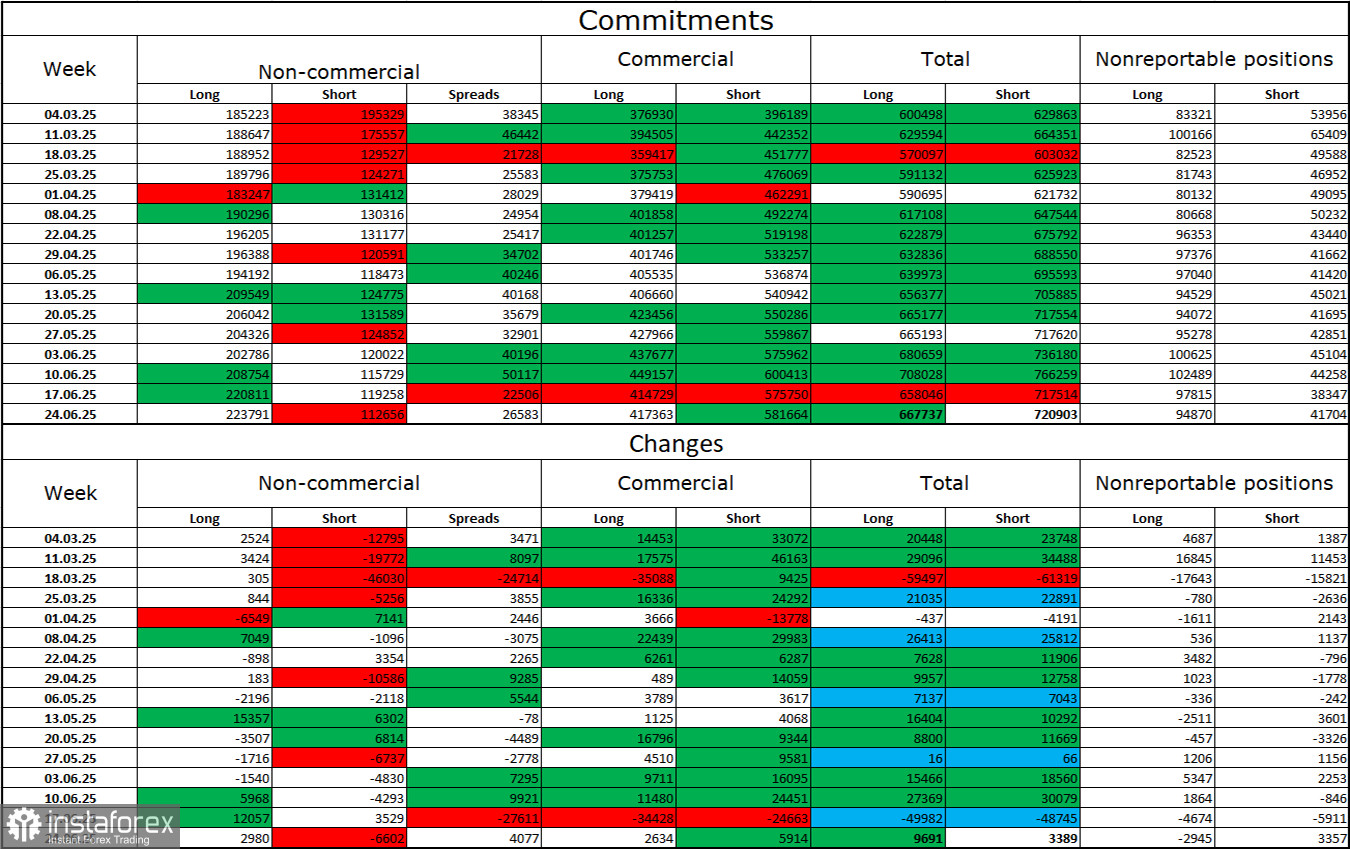
In the last reporting week, professional traders opened 2,980 new long positions and closed 6,602 short positions. Sentiment among the "non-commercial" group remains bullish, largely thanks to Donald Trump, and continues to strengthen over time. The total number of long positions held by speculators now stands at 224,000 versus 112,000 short positions, with the gap widening steadily. The euro remains in demand, while the dollar does not. The situation remains unchanged.
For twenty-one consecutive weeks, large players have been reducing short positions and building up longs. Although there is a significant difference in monetary policy between the ECB and the Fed, Donald Trump's trade policies are seen as a more important factor by traders, as they could lead to a U.S. recession and other long-term structural issues.
Economic Calendar for the U.S. and Eurozone:
July 3 brings at least three significant events on the calendar. The news background may strongly influence market sentiment in the second half of the day.
EUR/USD Forecast and Trader Recommendations:
Today, I would consider selling the pair if it bounces again from the 1.1802 level on the hourly chart, targeting 1.1712. I had previously recommended buying on a rebound from 1.1454 with targets at 1.1574, 1.1645, 1.1712, and 1.1802—all of which have now been reached. New long positions are possible if the pair closes above 1.1802, targeting 1.1888.
Fibonacci levels were drawn from 1.1574–1.1066 on the hourly chart and from 1.1214–1.0179 on the 4-hour chart.


