Lihat juga

 25.07.2025 09:41 AM
Sooner or later, this had to happen. After Bitcoin had made brave attempts to break above $120,000, the price dropped to nearly $115,000. In fact, this is nothing surprising, so be patient and wait for a deeper correction to around $112,000, or better yet, $110,000, before buying.

The decline, strangely enough, was inevitable. The market had overheated, euphoria peaked, and the lack of real factors for further growth inevitably led to a correction. This is quite a healthy situation, allowing things to cool down and regroup before the next push. Overbought indicators on weekly and daily charts have long been signaling the need to release some pressure. However, there's no need to panic and dump assets right now. The current pullback is a great opportunity for those who missed the previous rally to enter the market at a more attractive price. It's important to remember that Bitcoin is still in an uptrend, and short-term volatility is an inherent part of its nature.
It's also worth noting that for the past three days, there has been an outflow of funds from ETFs, and just yesterday, a net inflow of funds into US. Bitcoin ETFs amounted to $226.6 million. Among ETFs, the largest inflow on Thursday was recorded by FBTC from Fidelity, with $106.6 million. It was followed by HODL from VanEck with $46.4 million. IBIT from BlackRock, the largest spot Bitcoin ETF by net assets, also attracted $32.5 million. ETFs from Bitwise, Grayscale, and Franklin Templeton also reported inflows.
As I mentioned earlier, Thursday's inflow broke a three-day streak of outflows. On Wednesday, the outflow from spot Bitcoin ETFs was $86 million, on Tuesday it was $67.9 million, and on Monday it was $131.4 million.
Meanwhile, on Thursday, spot Ethereum ETFs reported a net inflow of $231.2 million, extending the inflow streak to 15 days. Apparently, this inflow allows Ether to balance at its current level without deeper drawdowns.
Trading recommendations
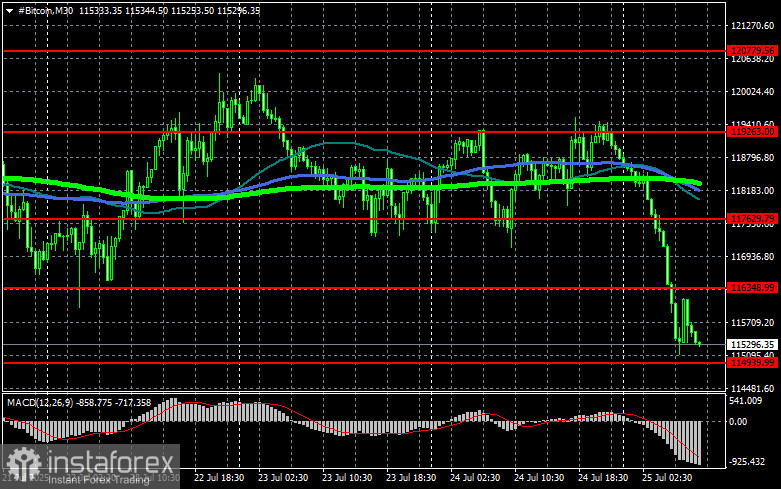
Regarding Bitcoin's technical picture, buyers are now targeting the return of the $116,300 level, which would open a direct path to $117,600, and from there, it's not far to the $119,200 level. The furthest target would be the high around $120,700, and its breakthrough would signal the strengthening of the bull market. If Bitcoin falls, buyers are expected at the $115,000 level. A return of the trading instrument below this zone could quickly push BTC down to around $112,800. The farthest target would be the $110,500 area.
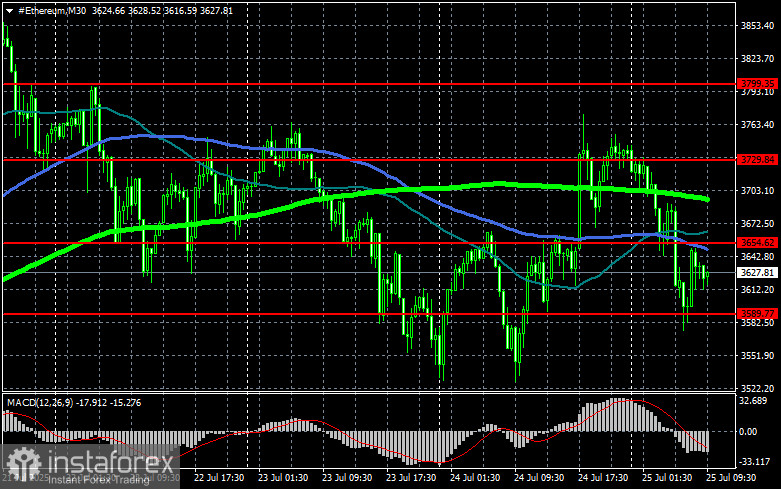
As for Ethereum's technical picture, a clear consolidation above the $3,654 level opens a direct path to $3,729. The furthest target would be the high around $3,799, and its breakthrough would signal a return of buyers' interest. If Ether falls, buyers are expected at the $3,589 level. A return of the trading instrument below this area could quickly push ETH down to around $3,512. The farthest target would be the $3,445 area.
What's on the chart


