Lihat juga

 07.08.2025 03:59 AM
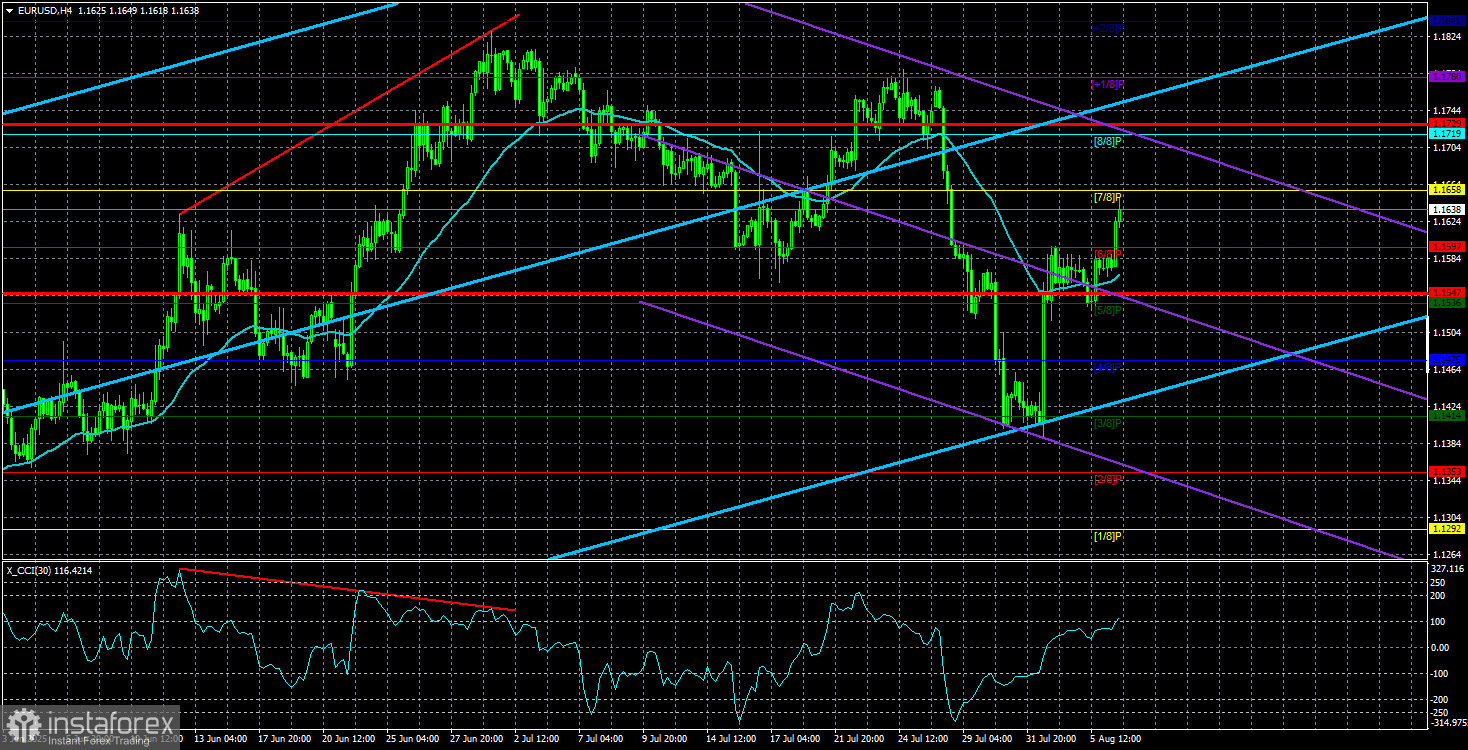
The EUR/USD currency pair traded with very low volatility for most of Wednesday once again. There are indeed very few macroeconomic events this week, but at the same time, it cannot be said that the news background is absent. We still believe that the events and reports from last week are enough for the dollar to continue declining for about another week. In addition to last week's events, we should also highlight some "fresh news."
Over the past few days, Donald Trump has announced the introduction of new tariffs. First, they will concern semiconductors and pharmaceuticals. There is nothing new in this announcement, as last month the U.S. president repeatedly threatened to impose tariffs on these categories of goods. This week, he merely confirmed his intentions, stating that medications should be produced in the United States. And to encourage domestic production, all foreign drugs will be subject to tariffs—starting small but rising to as much as 250% in a year and a half to two years.
Second, Trump is already moving into a second or even third round. Initially, he introduced individual tariffs against half the countries in the world. Then sector-specific tariffs followed (on cars, copper, steel, and aluminum, for example). Now, Trump is planning to implement "sanction tariffs." What does that mean? It means that if any country refuses to follow Trump's orders, it will face additional tariffs. For instance, India purchases oil from Russia and is perplexed by Washington's prohibition. The reason is that Trump wants to end the war in Ukraine and believes the financial inflows to the Russian budget from oil and gas exports must be limited. Thus, to end the war, all countries must stop buying Russian energy. To force this, Trump came up with "sanction tariffs" that will apply to all imports from such countries (India, in this case) to the U.S. until they stop buying Russian oil and gas—or until the war in Ukraine ends. And these tariffs will be very high.
This is how Trump is filling the U.S. budget. The main thing is to find a convenient pretext: Global unfairness toward the U.S.? Impose tariffs. Supporting domestic producers? Impose tariffs on foreign goods. Ending the war? Impose tariffs on everyone who "contributes" to its continuation.
In other words, Trump's actions may appear to be protective of national interests or even peace-promoting, but the real goal is simply to fill the budget with "free money."
Meanwhile, Trump continues to build a fully autocratic system, firing any official who has "offended" national interests. In the U.S., there can be no bad statistics, and the Federal Reserve must obey the president. Therefore, the head of the Bureau of Statistics was fired, and Fed representative Adriana Kugler resigned.
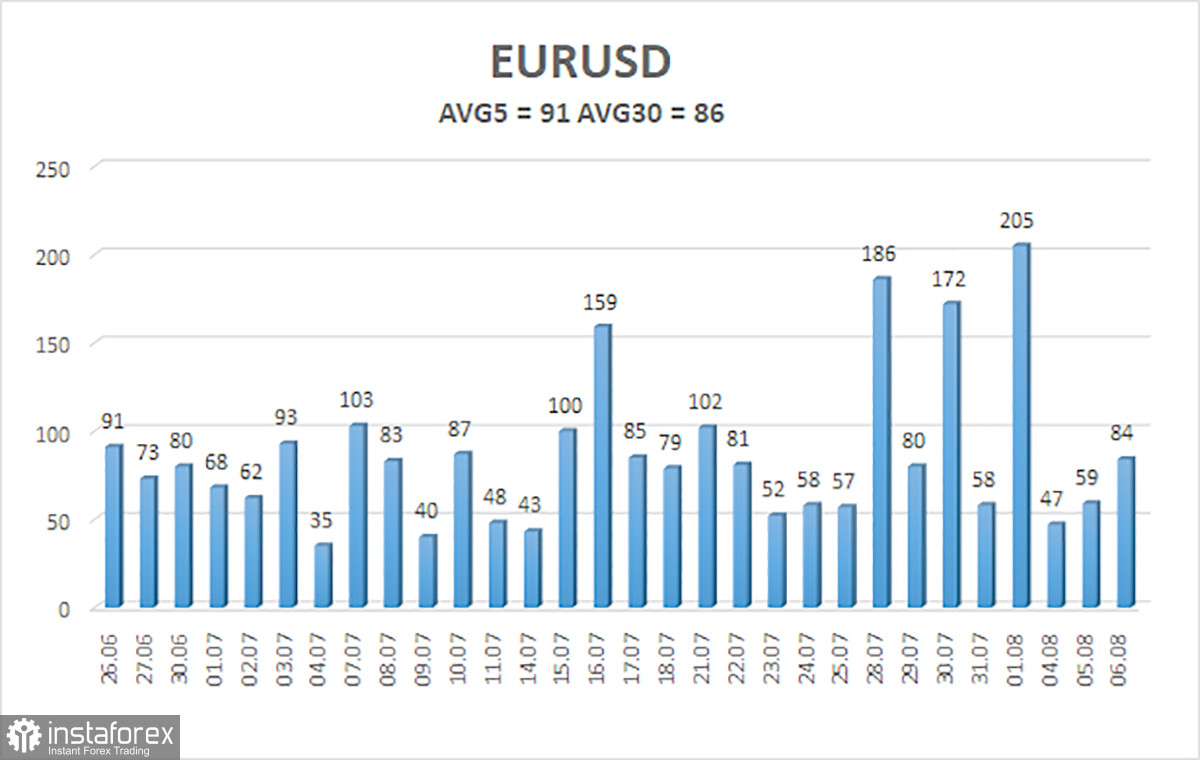
The average volatility of the EUR/USD currency pair over the past five trading days as of August 7 is 91 pips, which is considered "high." On Thursday, we expect the pair to move between the levels of 1.1547 and 1.1729. The long-term linear regression channel remains upward, indicating a continued uptrend. The CCI indicator has entered the oversold area for the third time, which once again signals a possible resumption of the bullish trend.
S1 – 1.1597
S2 – 1.1536
S3 – 1.1475
R1 – 1.1658
R2 – 1.1719
R3 – 1.1780
The EUR/USD pair may resume its upward trend. The U.S. dollar continues to be heavily influenced by Trump's policy, and he shows no signs of "slowing down." Last week, the world saw the consequences of that policy. The dollar rose as much as it could, but now it seems the time has come for a new prolonged decline.
If the price is located below the moving average, small short positions can be considered with targets at 1.1475 and 1.1414. If the price is above the moving average, long positions remain relevant with targets at 1.1658 and 1.1729, in continuation of the trend.
Linear Regression Channels help determine the current trend. If both channels are aligned, it indicates a strong trend.
Moving Average Line (settings: 20,0, smoothed) defines the short-term trend and guides the trading direction.
Murray Levels act as target levels for movements and corrections.
Volatility Levels (red lines) represent the likely price range for the pair over the next 24 hours based on current volatility readings.
CCI Indicator: If it enters the oversold region (below -250) or overbought region (above +250), it signals an impending trend reversal in the opposite direction.


